OPALE - 10.0 - Utilisation - Tableaux dynamiques/en
Différence entre versions
(Page créée avec « You now need to delete the extra line which is coloured in yellow here. This line comes from the vertical lines conditionnes according to the horizontal lines. We still ne... ») |
|||
| Ligne 120 : | Ligne 120 : | ||
[[FILE:12.jpg|875x875px|center|alt=]] | [[FILE:12.jpg|875x875px|center|alt=]] | ||
| − | + | You now need to delete the extra line which is coloured in yellow here. This line comes from the vertical lines conditionnes according to the horizontal lines. We still need these to manage vertical lines linked to the horizontal lines in the center of the table (the latter are coloured in yellow below). | |
[[FILE:13.jpg|520x520px|center|alt=]] | [[FILE:13.jpg|520x520px|center|alt=]] | ||
Version du 10 juillet 2019 à 15:06
STEP BY STEP GUIDE: HOW TO CREATE A DYNAMIC TABLE
A dynamic table is a table which adjusts it size according to its content. The content increases or decreases depending on the input spooled file.
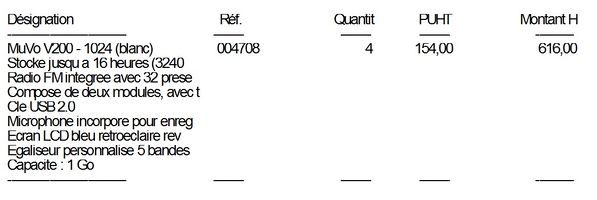
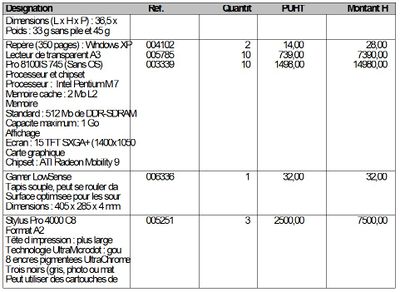
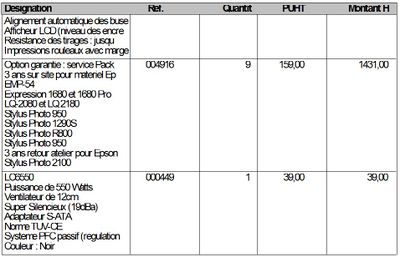
In the following example, the table you want to create displays the data of the table that is in the spooled file. The latter looks like the one below:
    ! Name                         !  Ref.  !  Quantity  ! Unit price excluding tax !  Price excluding tax  !
    ----------------------------------------------------------------------------------
    ! MuVo V200 - 1024 (white)     ! 004708 !        4   !                   154,00 !     616,00   !
    ! Stores up to 16 hours (3240 t!        !            !                          !              !
    ! Radio included with 32 preset!        !            !                          !              !
    ! Composed of two modules, with!        !            !                          !              !
    ! Flash drive 2.0              !        !            !                          !              !
    ! Microphone integrated to reco!        !            !                          !              !
    ! LCD screen blue backlighting !        !            !                          !              !
    ! Customed 5 tapes equaliser   !        !            !                          !              !
    ! Capacity : 1 Go              !        !            !                          !              !
                                                                                                                                                                                                                                                                                                                  ----------------------------------------------------------------------------------------
GENERAL PRINCIPLES
- Always use spaces BEFORE by default
- Put spaces AFTER only if you want extra space below the line
- The size of vertical lines and rectangles must be: space BEFORE + space AFTER
- Small vertical lines must be shifted in ordinate, Y: "- space BEFORE"
- Rectangles must be shifted in ordinate, Y: "+ space AFTER"
CREATING A VARIABLE GROUP
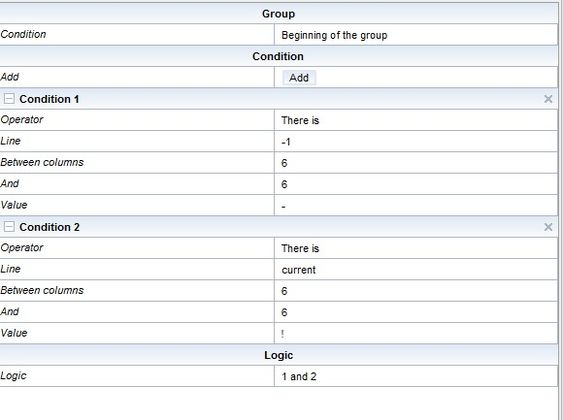
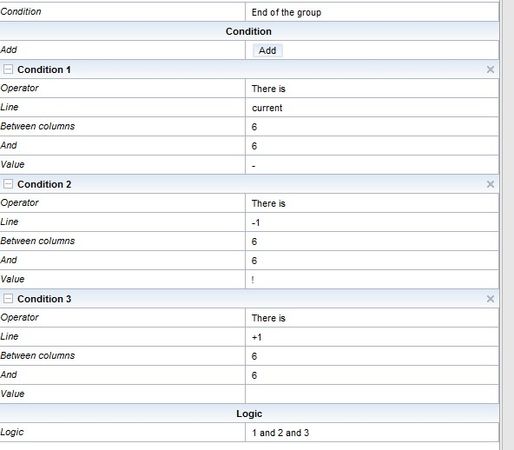
First create a variable group which defines the beginning and end lines of the table. (The beginning line contains the word "name" and the end line contains the characters "-" and "!" line -1 and "!" line -2).
Create a variable group:
BEGINNING CONDITION
In the group properties, select "type of stop condition" in "Condition". A drop down menu will appear in the group conditions: "Beginning of the group" and "End of the group"
END CONDITION
The range of data included in the group is displayed in blue below:
DISPLAYING THE CONTENT OF THE TABLE
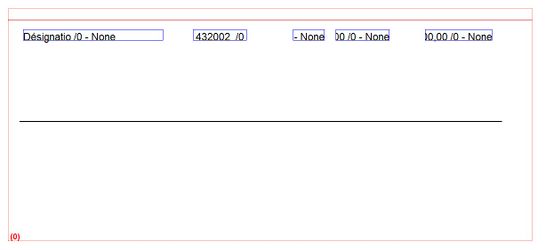
At this point, the group has a beginning and end, but it does not display anything because no zone was placed inside of it.
ALL THE LINES OF THE GROUP
Here is a preview of the table:
MANAGING HORIZONTAL LINES
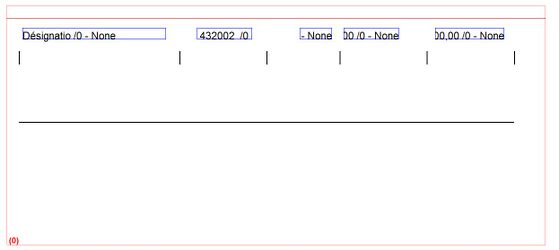
On the preview above, horizontal lines are discontinuous. To solve this issue, add a horizontal line that is conditioned according to the presence of the line in the input file. This line should only appear if you are on the dashed line.
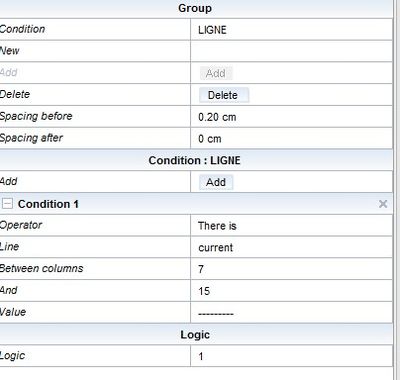
Here are the properties of the horizontal line you created:
Here is a preview of the table:
MANAGING VERTICAL LINES
Columns are missing on the preview above. To add some, add a vertical line, with height space before + space after, which is applied to all lines with the condition "none" and an ordinate shift, Y "- height of the line"
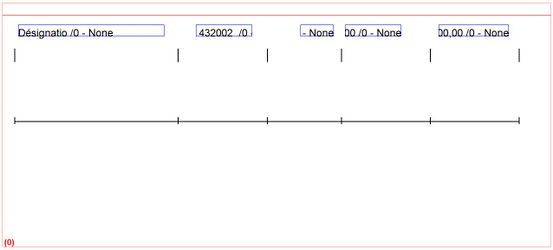
This preview shows that the line above each horizontal line is missing. To add it, add a vertical line and apply the horizontal line condition "LINE" (Copy-paste the lines above and apply the condition "LINE")
Here is a preview of the table at this point:
MANAGING THE HEADER LINE
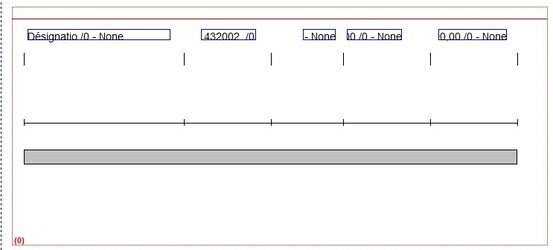
To highlight the header of this table you want to underline it in grey and format the content so that it is in bold. To do so, draw a rectangle with a height space before + space after and condition it according to the header line (Condition: HEADER).
Here is a preview of the table once this is done:
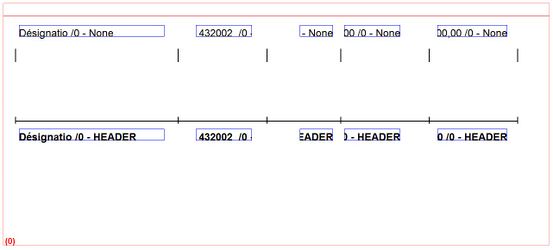
The column names are missing. The only objects that display the content of the spooled file are the zones (blue), and these zones are conditioned to "None". The line now "belongs" to the condition "HEADER". To solve this problem, add zones conditioned according to "HEADER".
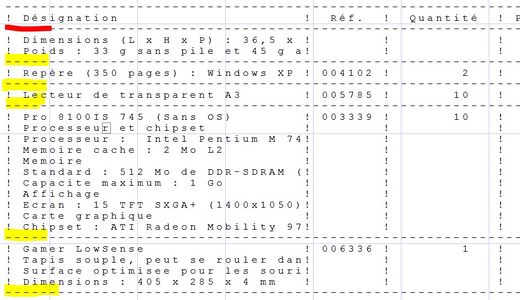
You now need to delete the extra line which is coloured in yellow here. This line comes from the vertical lines conditionnes according to the horizontal lines. We still need these to manage vertical lines linked to the horizontal lines in the center of the table (the latter are coloured in yellow below).
Cependant, nous voulons ignorer la première ligne horizontale (ligne en rouge). Cette ligne est de toute façon affichée avec le rectangle.
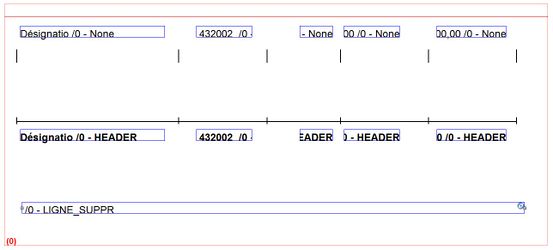
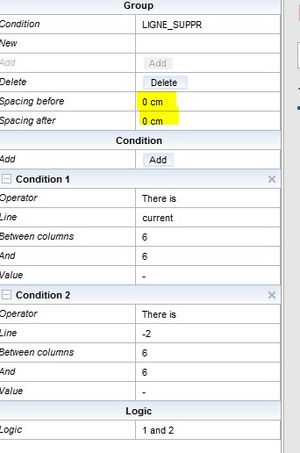
Pour cela, il faut créer une zone n'affichant rien et ayant 0cm comme espacement avant et après. La ligne va par conséquent disparaitre (être écrasée).
Voici le paramétrage de la ligne LIGNE_SUPPR :
Il ne reste plus qu’à faire quelques alignements à droite sur les valeurs numériques.
RÉSULTAT
Page 1 :
Page 2 :
Page 3 :
Le tableau est ainsi complètement dynamique en s’adaptant à son contenu.
