ONYX - 9.0 - Utilisation - Fonctionnement des graphiques/en
Différence entre versions
(Page créée avec « <b>IMPORTANT:</b><br/> Graph type areas must have the same name as the graph they are linked to. ») |
(Page créée avec « =Overlaid histograms= ») |
||
| Ligne 324 : | Ligne 324 : | ||
Graph type areas must have the same name as the graph they are linked to. | Graph type areas must have the same name as the graph they are linked to. | ||
| − | = | + | |
| + | =Overlaid histograms= | ||
Pour obtenir ce genre de graphique, il est nécessaire de superposer plusieurs graphiques : | Pour obtenir ce genre de graphique, il est nécessaire de superposer plusieurs graphiques : | ||
Version du 2 janvier 2025 à 10:17
ONYX Designer includes a graphics creation module whose operation is explained below.
Sommaire
Create a new graphic
- - Click on the Graphic icon on the Variable toolbar.
- - Click on the page and drag the mouse to draw the frame where the graphic will be printed.
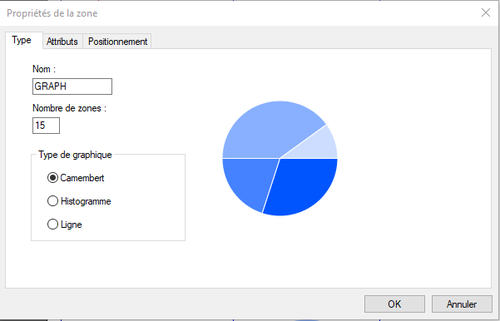
- - Enter a name, a number of zones, and check the type of chart you want to print.
The number of zones to enter is the maximum number of zones that your graph can contain.
Configure a chart
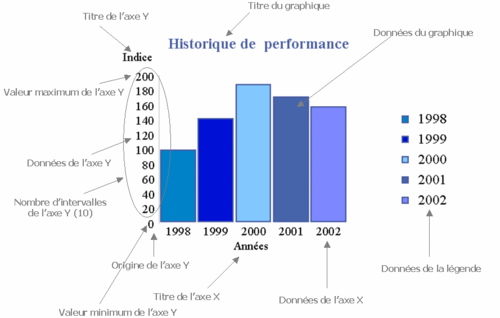
The graphics allow fairly advanced configuration. You can modify axis titles, number of intervals, maximum values…
For all these parameters, you can either set the values for this graph or retrieve this information from the spool. The information retrieved from the spool will take priority over the values defined “hard” for this graph.
This is useful, for example, in the case where the chart title is not present in all pages of the spool. This amounts to considering the values in the chart as default values. In this case, the graphic type zones must be conditioned on the presence of a value in the spool.
- - Chart title
- - Title of the axes
- - Axis data
- - Minimum / maximum values
- - Number of Y axis intervals
- - Y axis origin
- - Round Y axis values
Graphic type area
These areas allow you to completely configure your graph according to the spool values: titles, legend, axes, etc.
- - Chart data
- - X axis data
- - Y axis data
- - Chart title
- - X axis title
- - Y axis title
- - Legend data
- - Minimum value of Y axis
- - Maximum value of Y axis
- - Number of Y axis intervals
- - Round to the nearest n in the Y axis
- - Y axis origin
Retrieving data field
A chart does not retrieve data from the spool on its own. It uses graphic type areas. This allows you to completely condition data recovery.
To associate zones with a graph, simply give them the same name.
The zones can of course belong to a group, fixed or variable, be conditioned...
Font and style information is not used.
A Graphic type zone does not print anything on its own.
Retrieve data from the spool as chart data
- - Create your zone (positions in the original file, condition, group membership, etc.)
- - Name it as the complex graph it depends on
- - Select type Graphic
- - Choose subtype Chart Data
Configuration
Round Y axis values
To round the Y axis data values, you can either:
- - Create a zone of type Graphic / Round the Y axis to the nearest n recovering the value "n" in the spool
- - Set value in chart properties
To change the rounding pitch:
- - In the chart properties, select the Positioning tab
- - Double-click on the image representing the graph
- - In the Y Axis tab, change the value
Font and style
The font and style of the axes are defined in the chart properties and not in the chart type boxes. Even if you don't set a label in the chart properties, you must set the font to use.
Axis data
To define the axis data, you must create a Graphic / X axis data (or Y) zone retrieving the values in the spool.
Font and style
The font and style of the data are defined in the chart properties and not in the chart type boxes.
To change the font and style:
- - In the chart properties, select the Positioning tab
- - Double click on the chart image
- - Change the values of the Y Axis Font or X Axis Font tab
Number of Y axis intervals
To set the number of Y axis intervals, you can either:
- - Create a zone of type Graphic / Nbr of intervals of the Y axis recovering the value in the spool
- - Set this number in chart properties
To set the number of intervals in the chart properties:
- - In the chart properties, select the Positioning tab
- - Double-click on the image representing the graph
- - In the Y Axis tab, modify the value
Font and style
The font and style of the axes are defined in the chart properties and not in the chart type boxes. Even if you don't set a label in the chart properties, you must set the font to use.
Y axis origin
To set the origin of the Y axis, you can either:
- - Create a zone of type Graphic / Origin of the Y axis recovering the value in the spool
- - Set value in chart properties
To set the origin of the Y axis in the chart properties:
- - In the chart properties, select the Positioning tab
- - Double-click on the image representing the graph
- - In the Y Axis tab, modify the value
Font and style
The font and style of the axes are defined in the chart properties and not in the chart type boxes. Even if you don't set a label in the chart properties, you must set the font to use.
Axis titles
To give a title to the axes, you can either:
- - Create a Graphic / Title of the X axis (or Y) type zone retrieving the title in the spool
- - Set title in chart
To set the axis title in the chart:
- - In the chart properties, select the Positioning tab
- - Double-click on the X axis title area
- - Enter a value in the label
Font and style
The font and style of the axes are defined in the chart properties and not in the chart type boxes. Even if you don't set a label in the chart properties, you must set the font to use.
Chart title
To give a title to the graph, you can either:
- - Create a zone of type Graph / Title of the graph retrieving the title in the spool
- - Set title in chart
To set the axis title in the chart:
- - In the chart properties, select the Positioning tab
- - Double-click on the Graphic Title area
- - Enter a value in the label
Font and style
The font and style of the axes are defined in the chart properties and not in the chart type boxes. Even if you don't set a label in the chart properties, you must set the font to use.
Minimum / maximum values
To set the min and max values for the Y axis, you can either:
- - Create a zone of type Graphic / Maximum (minimum) value of the Y axis retrieving the value in the spool
- - Set this value in chart properties
To set the min and max values in the chart properties:
- - In the chart properties, select the Positioning tab
- - Double-click on the image representing the graph
- - In the Y Axis tab, modify the values
Font and style
The font and style of the axes are defined in the chart properties and not in the chart type boxes. Even if you don't set a label in the chart properties, you must set the font to use.
Parameters
Round to the nearest n in the Y axis
This type of zone allows you to round the values of the vertical axis (for histograms and lines).
X axis data
This type of zone retrieves values from the spool to use as horizontal axis data (for histograms and lines).
Y axis data
This type of zone retrieves values from the spool to use as vertical axis data (for histograms and lines).
Legend data
This type of zone retrieves from the spool the values which will be used to draw the legend.
This is the caption text.
Chart data
This type of zone retrieves from the spool the values which will be used to draw the graph.
It only retrieves signed digital data. Other characters are ignored.
Number of Y axis intervals
This type of zone retrieves values from the spool to use as the number of vertical axis intervals (for histograms and lines).
X axis origin
This type of zone retrieves a value from the spool as the origin of the vertical axis (for histograms and lines) i.e. as the first value of the axis.
X-axis title
This zone type retrieves a value from the spool as the title of the horizontal axis (for histograms and lines).
Y-axis title
This zone type retrieves a value from the spool as the title of the vertical axis (for histograms and lines).
Chart title
This zone type retrieves a value from the spool as the graph title.
Maximum value of Y-axis
This zone type returns a value of the spool as the maximum value of the vertical axis (for histograms and lines).
Attention, if a chart data exceeds this value, it will not be displayed corre
Minimum value of Y-axis
This zone type returns a value from the spool as the minimum value of the vertical axis (for histograms and lines).
Attention, if a chart data is less than this value, it will not be displayed correctly.
Barcodes
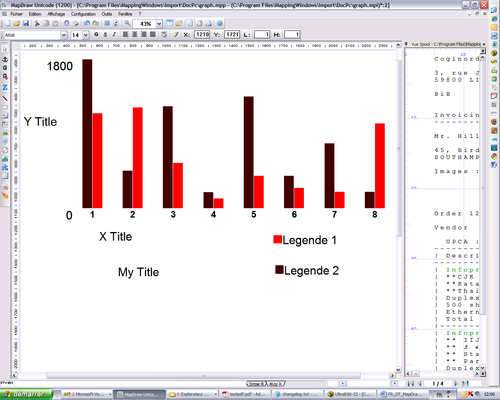
To create a barcode in MapDraw, simply create an object of type “Graphics”.
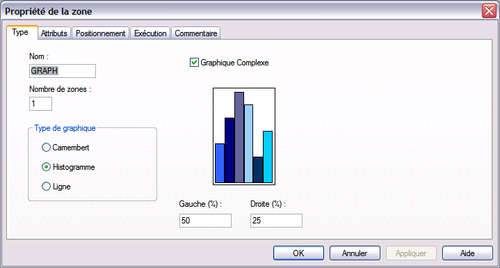
In the “Type” tab, the number of zones represents the number of types of values to represent, in most cases only one zone is required. The use of multiple zones allows you to define a particular color and style for each value of the chart.
The “Attributes” tab allows you to define the appearance, color, fill type, etc. of each zone.
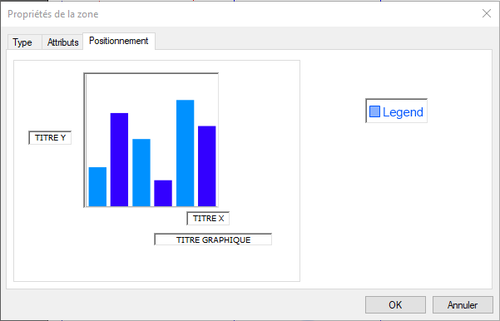
The “Positioning” tab allows you to position each element of the graph, including the graph itself, the title of each axis, the title of the graph as well as the legend.
By double-clicking on a particular element, the Properties window is accessed allowing you to modify the properties of the object (character police, color, etc.)
Defining Chart Values
To define the graph attributes and add values, graph type zones must be added.
The possible parameters are:
- - Graph Data
- - X-axis data
- - Y-axis data
- - Chart title
- - X-axis titer
- - Y-axis title
- - Legend data
- - Minimum value of Y-axis
- - Maximum Y-axis value
- - Number of Y-axis intervals
- - Rounding the Y-axis values to n
- - Y-axis origin
These zones allow you to retrieve information from the spool and use it in the graph.
IMPORTANT:
Graph type areas must have the same name as the graph they are linked to.
Overlaid histograms
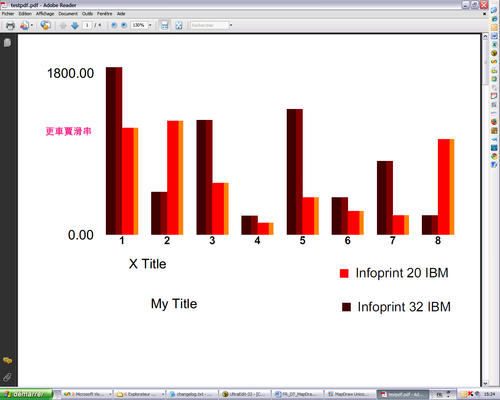
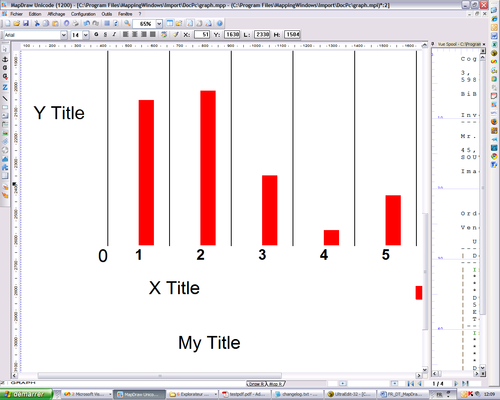
Pour obtenir ce genre de graphique, il est nécessaire de superposer plusieurs graphiques :
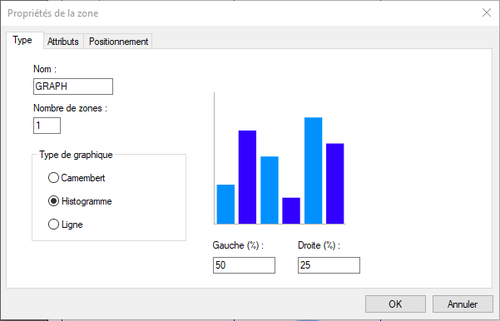
Il suffit de jouer sur l’espacement en pourcentage Gauche et Droite :
Par défaut, une barre d’un histogramme prend toute la largeur disponible (100%), mais en modifiant ces paramètres, il est possible de réduire la largeur de la barre ainsi que sa position en lui apportant un écart différent à droite et à gauche.
Il suffit ensuite de superposer plusieurs graphiques avec divers paramétrages d’espacement pour obtenir le rendu souhaité :
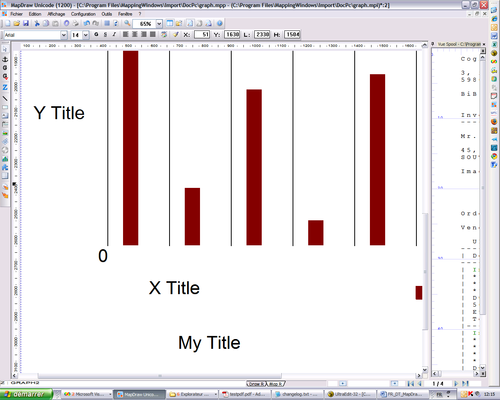
Ici, quatre graphiques superposés donnant un aspect 3D.
Exemple
+
=
Positionnement dynamique du graphique
Un graphique est considéré comme une zone fixe, il est donc impossible de le placer dynamiquement sur la page en fonction des zones se trouvant avant lui.
Cependant, on peut jouer autour de cette règle grâce à des conditions.
Avec un spool PAG/TXT
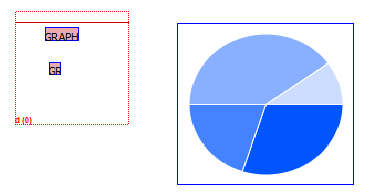
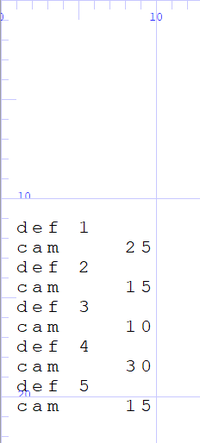
Voici un exemple simple de spool paginé qui contient des données à utiliser dans un camembert. Il faut mettre des conditions d’apparitions pour que le graphique n’apparaisse que si les lignes sont à certaines valeurs.
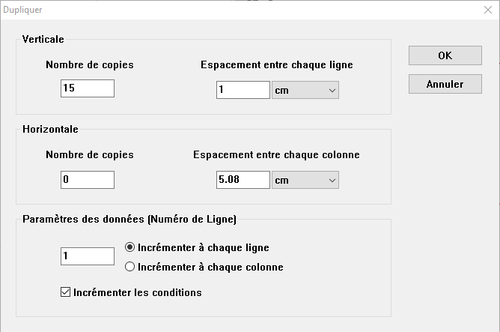
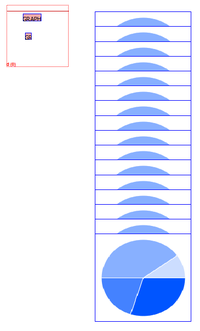
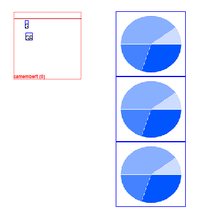
Ensuite il faut dupliquer le graphique. Par exemple, on va créer 15 nouveaux graphiques avec les même paramètres, mais chacun décalé de 1cm vers le bas de plus que le précèdent. Il est important d’incrémenter les conditions, sinon la zone ne va se baser que sur les mêmes lignes.
Après duplication, on obtient ceci, chaque graphique est décalé de plus en plus vers le bas et vérifie des lignes différentes dans le spool.
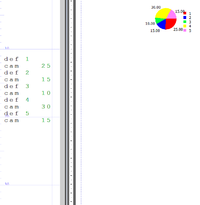
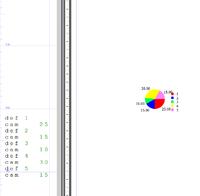
Première image : Les données commencent ligne 12. Seconde image : les données commencent ligne 22.
Le graphique a donc changé de position selon la position de ses données dans le spool.
C’est la seule façon de positionner une zone fixe de façon pseudo-dynamique, mais une évolution future d’ONYX devrait permettre de fournir une solution plus simple et adaptée.
Avec un spool XML
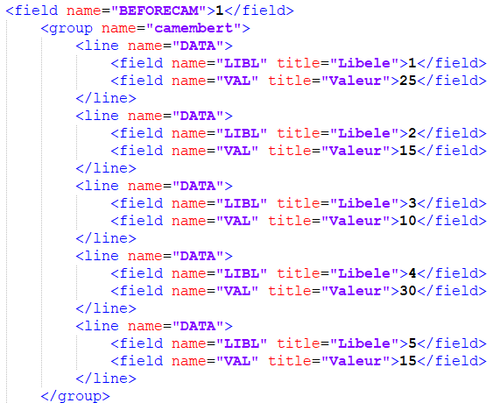
Le meilleur moyen de rendre la position d’un graphique dynamique avec un spool XML et de rajouter un field dans le fichier d’entrée contenant le nombre de zones présentes avant le graphique, car on ne peut pas se baser sur le nombre de ligne ou toutes autres informations provenant du spool car le graphique n’en fait pas parti.
Par exemple : Le field “BEFORECAM” indique combine de zones sont présentes avant le camembert, pour l’exemple, sa valeur est de 1.
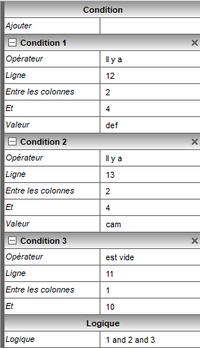
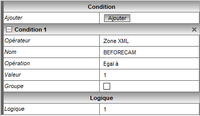
Voici la condition sur le premier graphique :
On peut utiliser le bouton dupliquer, mais il faut changer la valeur manuellement car ce n’est pas une ligne, donc l’incrémentation ne changera rien.
Le premier graphique n’apparait que si la valeur est égale à 1, le deuxième si c’est 2, etc…
Le problème de cette solution, c’est qu’elle demande une modification du potentiel Connect qui génère le fichier XML pour rajouter le champ, et lui attribuer une valeur en fonction du contenu des fields précédents.
La méthode XML est plus risqué car on ne connait pas le nombre de ligne présent dans les champs XML précédant le camembert, il faudrait donc rajouter beaucoup plus de graphique, ou faire plusieurs code-lettre pour s’adapter en fonctions des différents blocs.
