ONYX - 9.0 - Utilisation - Utilisation de ONYX Designer/en
Différence entre versions
| Ligne 5 : | Ligne 5 : | ||
{{:ONYX:9.0:Utilisation:Création Projet de ONYX Designer/en}} | {{:ONYX:9.0:Utilisation:Création Projet de ONYX Designer/en}} | ||
{{:ONYX:9.0:Utilisation:Fond de page de ONYX Designer/en}} | {{:ONYX:9.0:Utilisation:Fond de page de ONYX Designer/en}} | ||
| − | {{:ONYX:9.0:Utilisation:Partie Dynamique de ONYX Designer}} | + | {{:ONYX:9.0:Utilisation:Partie Dynamique de ONYX Designer/en}} |
{{:ONYX:9.0:Utilisation:Génération d'un projet de ONYX Designer}} | {{:ONYX:9.0:Utilisation:Génération d'un projet de ONYX Designer}} | ||
{{:ONYX:9.0:Utilisation:Fonctionnalités avancées de ONYX Designer}} | {{:ONYX:9.0:Utilisation:Fonctionnalités avancées de ONYX Designer}} | ||
Version du 26 juillet 2019 à 10:08
Sommaire
- 1 Introduction
- 2 Configuring Designer
- 2.1 General
- 2.1.1 Automatic save
- 2.1.2 Lock projects upon opening
- 2.1.3 Create .bak files
- 2.1.4 Select object before moving
- 2.1.5 Enable script editor
- 2.1.6 Show all component errors
- 2.1.7 Straight lines
- 2.1.8 Temporary folder
- 2.1.9 List of characters to be displayed in double width
- 2.1.10 Default style
- 2.1.11 Language
- 2.2 Configuring the servers
- 2.3 Font
- 2.4 Calculation options
- 2.1 General
- 3 Interface of the application
- 4 Creating a project
- 5 Overlay (Draw Tab)
- 6 Dynamic Part (Map Tab)
- 7 Générer un projet
- 8 Fonctionnalités avancées
Introduction
Objectives
In the ONYX suite, ONYX Designer is the module dedicated to creating document templates. This page is a reference guide for the configuration and usage of Designer in the ONYX Suite. This introduces you to all the features of the application.
Prior training is required to use Designer. This page is not intended to replace the dedicated training.
Presentation of Designer
Designer is the design and graphic mapping module for documents. It is used to transform simple files with static data into high-quality graphic documents.
In the ONYX Suite, Designer relies on the use of XPS Mapping design language (MXPS).
No software keys are required to use Designer on a Windows workstation.
The software runs on Windows workstations and features a dual sided user interface. The first part is a drawing view used to create overlays, which can be compared to pre-printed paper in the printing industry. The second part is a dynamic view used to retrieve data, manage it and display it.
Whether it comes from a file, is extracted from a database or an ERP, or is formatted beforehand via the Connect software, data is displayed "flat" (paginated text format) or in XML (compatible with Designer - see 6.3 Mode XML : syntax and specifications).
The template (document template) is designed on the user workstation that is hosting the application with a "Preview" mode to validate changes as soon as they are made. During the design process, the document template is called a Designer Project.
The template is then generated and imported on the ONYX Server (Linux or Windows) to be used in production. This is then called a Designer Format.
ONYX:9.0:Utilisation:paramétrage de ONYX Designer
Configuring Designer
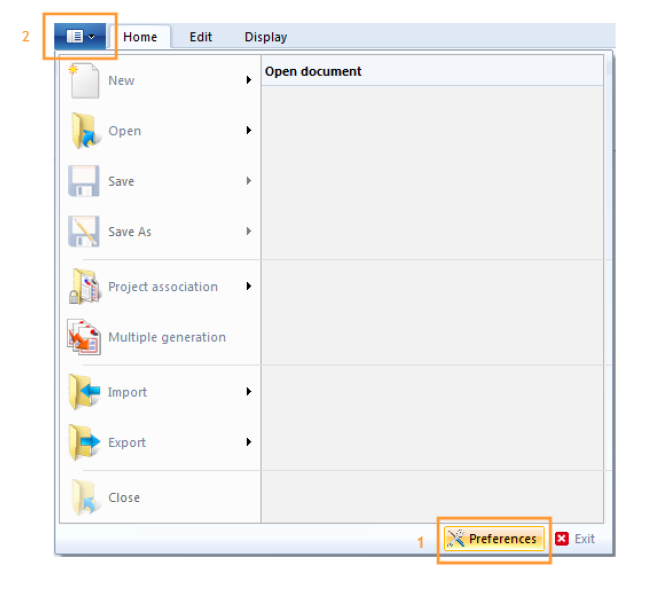
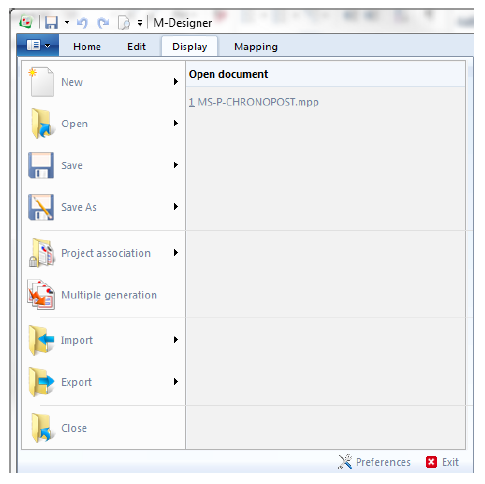
After Designer was installed, the first step is to configure the Preferences (see 1) of the application. They are accessed from the File menu (see 2). The preferences are local to the current user and are stored in the Windows registry of the workstation under HKEY_CURRENT_USER/Software/Mapping.
General
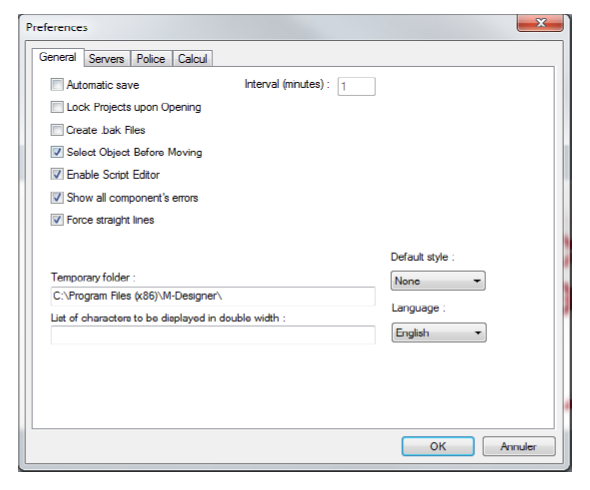
The first tab of the Preferences window displays the general options of the application.
Automatic save
This option programs an automatic save of the projects being designed (opened in the application). The projects are saved at regular intervals defined in minutes in the corresponding input field.
Lock projects upon opening
As will be referred to later in this guide, several users can work with Designer at the same time using a common folder for projects. In this case activating this feature is recommended as it will prevent concurrent access to the same project.
As soon as a user opens a project, writing access is denied to other users. Other users can then only access the project in read-only mode.
Create .bak files
This option allows you to keep N-1 versions of the project when saving it. The corresponding files then have the ".bak" suffix added as their extension.
Select object before moving
As will be referred to later in this guide, All objects positioned in the document template can be edited and moved around. This option forces the user to select an object before he can move it. This prevents objects from being moved accidentally as you select them.
Enable script editor
This option allows you to create, edit, or delete scripts. (see Script editing link)
Show all component errors
This option affects the number of error windows appearing when opening a project with components that are unavailable in the project folder.
- Activated by default, one window is displayed per missing component, asking for the user to provide said component.
- Deactivated, component errors are gathered and displayed in the same window.
Straight lines
This option forces the application to only draw horizontal or vertical lines (most currently used) by disabling oblique lines.
Temporary folder
This option defines the path of the temporary folder. By default, this is the folder for the installation of the application but this value can be changed if needed.
List of characters to be displayed in double width
This input field allows you to add hexadecimal values (or ranges of values) of specific characters to consider and display in double width.
This option is useful to display datastreams in the Spooled file view and preview the document template in real time. A similar feature can be found on Onyx Server in the configuration variable MAPCPYSPLF_DBCSPITCH_LIST.
Default style
This list is used to select or not select a style template to define a list of colours, line type, fonts, etc. for your project.
Language
This option is used to choose the display language of the interfaces of the application. The default language of Designer is the same as that of your operating system. The available languages are English, French and Japanese.
Changing the language of Designer affects the other tools in the Suite, including Connect, and the application has to be restarted for any change to be registered.
Configuring the servers
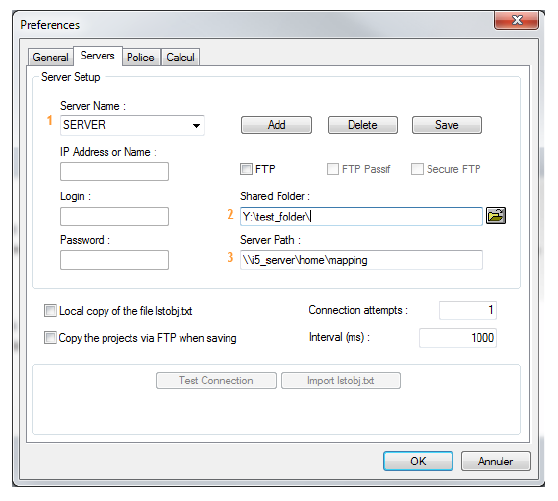
The Servers tab of the Preferences view is used to configure the paths the application must have access to:
- The shared folder of the Designer projects sources.
- The import folders for formats in Onyx Server.
The shared sources folder contains all the projects developed by all the Designer users.
Once developed, Designer projects mut be generated on the production server in the import folder.
Here are the default paths of the import folder of the Onyx Server according to the type of platform used:
- Unix: /apps/mapping/import/
- Windows: C:\Mapping\M-Processing Server\Import\
To generate the project, a connection must be established between the development workstations and the production server. Two types of configurations are possible.
Required settings:
- Name of the server: Name given to the configuration.
- Shared folder: Shared folder for the sources.
- Access path: destination path of the generation.
- Import folder: Onyx Server import folder, only used for option "Send mapping".
The server access folder can be:
- A UNC path Examples:
\\test_server\ProgramData\M-Processing Server\Import\ (under Windows)\\test_server \home\mapping\ (under iSeries)
- A network drive with the address of the import folderExample: either a network drive "M:" with the address of the "...\M-Processing Server" folder of the production server. The access folder thus contains "M:\Import\".
In the case of a UNIX production server, a "Samba" type software application must be installed for this connection mode so that the development workstation can communicate with the production server. Connections using the FTP mode are preferable.
Access to the server using an FTP connection
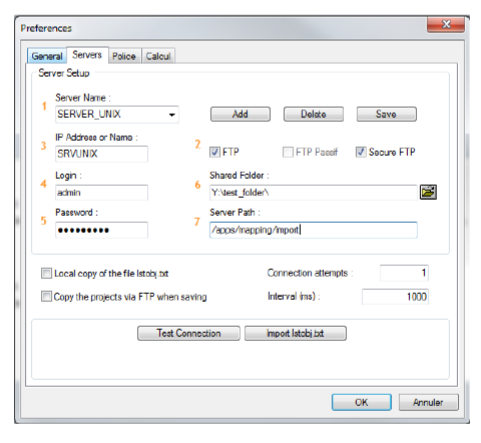
In this case, an FTP (or SFTP) connection must be established between the development workstation and the production server.
Required settings:
- Name of the server: Name given to the configuration.
- FTP/FTP Passive/Secure FTP: Choice of connection mode: FTP, FTP Passive, Secure FTP.
- IP address or Name: IP address of the production server.
- Login: User name for the FTP access.
- Password: Related password.
- Sharing folder: Shared folder for sources.
- Access path: Access path to the Onyx Server import folder.
- Import folder: Onyx Server import folder, only used for the "Send mapping" option.
Font
The Generation of XPS fonts by code page field is used to pre-load XPS fonts by defining one or several code-pages to optimise processing time during the process. The separation character used is code-pages is ";".
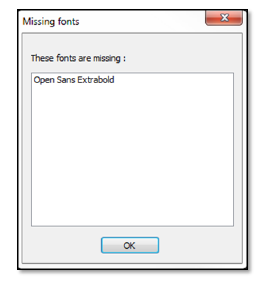
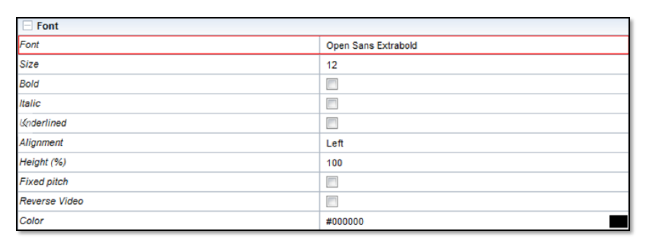
Note: When a project is imported, if it is written in a non-registered font, a warning message is displayed in red in the "Properties" of the zone affected, specifying that the font is missing.
Calculation options
The two options in the Calculation tab define thousands and decimal delimiters. This information is used to retrieve integer or real values in the application (by memory zones), calculations and results display in the preview.
Neither of them affect the generation of projects.
Similar options exist for execution in M-Processing Server: MAPCPYSPLF_THOUSAND and MAPCPYSPLF_DECIMAL.
These settings are used to run all templates, however, they can be set differently before running any Mapping commands, to use other delimiters and fit regional standards.
Interface of the application
General presentation
When using Designer for the first time, only the overlay designing view is displayed. This simple display mode allows you to only activate the windows you need.
Window activation is explained in 3.2.a File menu.
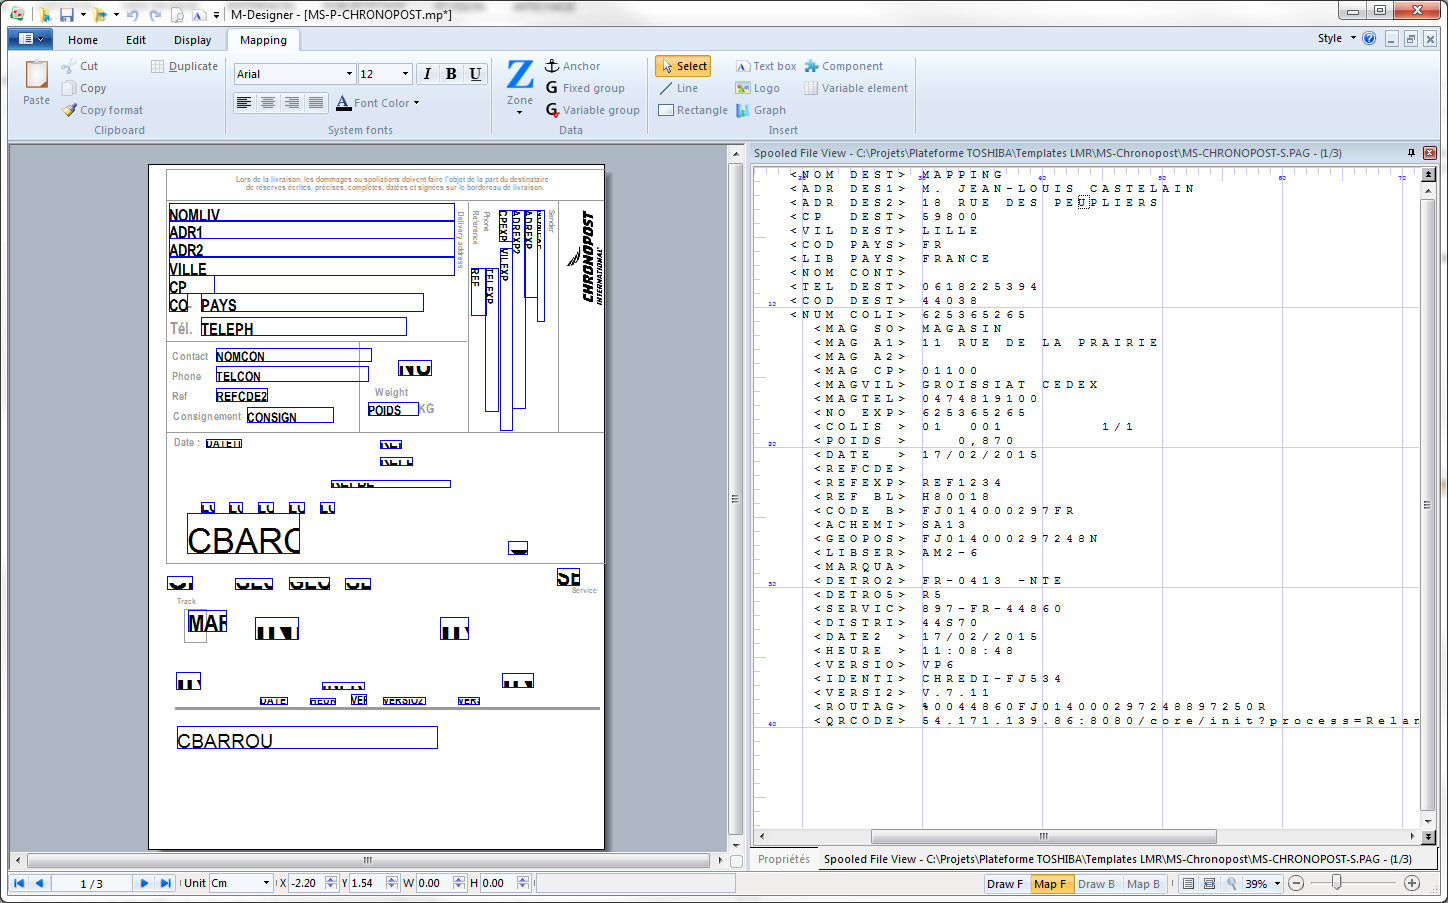
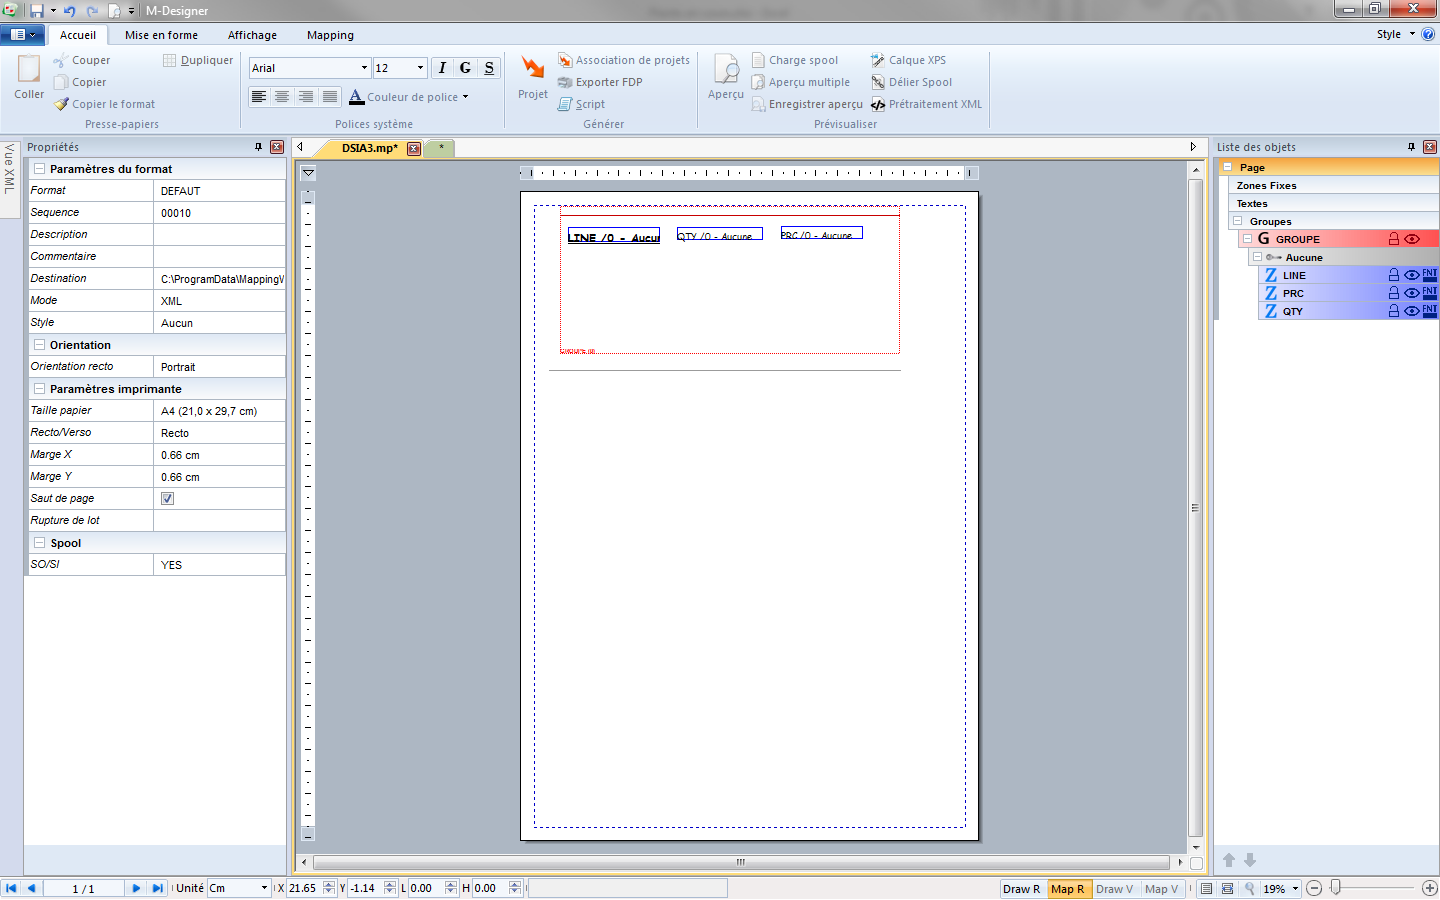
The following image shows an overview of the Designer user interface. In this example, the Spooled File View, Properties, Conditions and Object Tree windows are activated.
It is divided in several parts:
- 1: File Menu
- 2: Tabs in the Ribbon
- 3: Groups of tools associated with each tab of the Ribbon
- 4: Status bar with the tools used to position and size objects
- 5: Navigation between the static and the variable parts of a project + display zoom tools
The Designing Space where templates are designed is found between the menus and tools displayed at the top of the window and the status bar located at the bottom.
This design space can also be made up of several views, in addition to the central Designing view:
- 6: Properties View: of the format, of an object selected in the template
- 7: Spooled file View: included in the same display space as the Properties, multiple tabs are now available.
- 8: Object Tree View list of all the objects in the template (static and variable parts)
- 9: Conditions View: of the format, of a selected object.
The display positions of each view can be configured according to the user preferences and habits. To do so, hold the button of your mouse down when clicking on the title of the View, then drag the mouse to the required display area or on an already positioned view, a display space with several views is now shown.
Menus and associated toolbars
This part introduces you to the different menus and options available within them, in the Designer interface. Each notion will be further detailed in the following parts.
File Menu
New:
- Project: creates a new project with default properties (DEFAULT format, sequence 00010, in A4, simplex).
- Component: creates a new component with default properties (A4, simplex).
- Variable element: creates a new variable element with default properties (A4 simplex).
- Document: creates a new Overlay document (.mpw) or Dynamic document (.mpi) according to the selected view (Draw F or Map F). This overwrites the current document.
Open:
- Project: opens an existing project by browsing file paths. The folder selected by default depends on the Server preferences of the application.
- Component: opens an existing component.
- Variable Element: opens an existing variable element.
- Document: opens an existing Overlay (.mpw) or a Dynamic document (.mpi), according to the selected view (Draw F or Map F). This overwrites the current document.
- Spooled File: used to select a spooled file to load in the application as a designing data template.
Save:
- Project: saves the curent project. Source files of the project will be saved, N-1 versions may also be saved according to user preferences.
- Document: saves the current Overlay (.mpw) or Dynamic document (.mpi), according to the view displayed (Draw F or Map F).
Save as:
- Project: saves the current project under an other name. Source files of the project will be saved under the new names given by the user.
- Document: saves the current document (.mpw or .mpi) under an other name.
Project association:
- Links several projects to make their generation easier. A project association creates a settings file on the disk, with a *.mpa extension, in which the projects concerned and the generation options are listed.
Multiple generation:
- Selects multiple Designer projects to generate them all at once.
Import:
- Designer file: imports another existing Designer overlay such as a component, or the static part of another project, in the static part of the current project.
- XML Designer: imports an entire Designer project in the application, after it was exported to XML. This imports the XML file as a new project, retrieving all its properties and designs.
- Resources: imports an external resource as overlay of a new project, in the application. Resources can either be XPS documents or AFPDS overlays.
Export:
- Printer (PCL5): prints the overlay of the current project on a printer registered on the workstation.
- Project: selects one or several projects to export in an archive (.zip) with the potential associated spooled files.
- XML Designer: exports the entirety of the current project in an XML description file. All properties and designs of the project are found in the resulting file which will then be imported in an other instance of the application, on an other workstation for instance.
Close:
- Closes the current project or document and detects unsaved changes.
Preferences:
- See 2.1 General.
Home Menu
The Home menu gives access to the general options of the project or document being created:
Clipboard:
- Cut/ copy/ paste one or several elements selected in the project (standard keyboard shortcuts Ctrl+X, Ctrl+C and Ctrl+V are also available)
- Copy the formatting of an element onto others (texts or shapes)
- Duplicate a selected element and set the required number of horizontal and vertical occurrences (this is useful when creating sheets of labels for instance).
System fonts:
- Text standard formatting: choose the TTF system fonts available on the workstation (Windows), the size, colour, bold/ underlined/ italic, justified or aligned.
Generate:
- Generate the project being created. This option is only available for projects being created (opened in the application).
- Generate an existing project association.
- Export overlay (see the File Menu part).
- Access the script utility in the Designer application.
Preview:
- Preview project currently being created.
- Select and load a spooled file in the application (this is useful when designing a document and previewing it).
- Multiple preview for multi sequence projects.
- Save an image of the preview.
- Load an XPS file as a layer (not included in the generation but displayed in the design as a pre-printed form).
- Unlink the source file (spooled file) to the template and close it.
- Carry out processings on XML input file using scripts.
Edit Menu
The Edit menu gives access to designing options of the current project or document:
In addition to the Clipboard and Font system sections, the following tools are also available in this menu:
Sort:
- Applied to one or several selected elements, sorting can bring them to the front or to back, manage alignments and rotations. These options can also be accessed by right clicking on the selected elements and further detail will be given in the following parts of this documentation.
Position according to grid:
- To help with designing, a grid can be displayed to make positioning elements easier for the user. The two options of this section help to adjust the spacing of the grid (size of the grid and thus the precision of element positioning) and snap objects to the grid while they are moved.
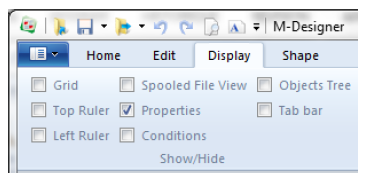
Display Menu
The Display menu gives access to display options of the different views of the application:
Show/Hide:
Given that none of these options are activated when opening the software for the first time, the functions which are most suitable for the basic use of Designer will be marked with the term (recommended).
- Grid: displays the grid in the designing view.
- Top/Left Ruler: displays the top and left hand rulers of the designing view. It is possible to place guides in these rulers in order to align objects more easily. A Left click on the ruler places and collapses a rule-guide. A Right click on an existing rule-guide deletes it.
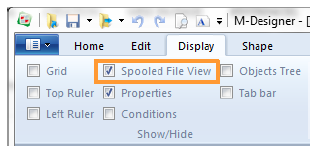
- Spooled file view: displays the loading view of the example spooled file (or XML file) (recommended).
- Properties : displays the properties view of the project and elements (recommended).
- Conditions: displays the conditions view (recommended whenever the design work deals with a dynamic part).
- Object Tree: displays the list of all the elements positioned in the document template, some features related to the elements can also be accessed.
- Tab bar: displays the tab navigation bar for the different projects opened in the application.
Characters list:
- Lists all the characters supported by the application according to a code page and font. This can be useful to insert special characters, which cannot be directly typed in, in a document.
Refresh:
- Refreshes the screen.
Windows:
This helps you manage the many windows of your projects opened in the application. It allows you to activate, save or close some of them or all of them all at once.
Shape Menu
This menu features all the drawing and composition tools for your document template. This menu is arranged differently depending on the part of the project concerned, the overlay part (static) or the dynamic part (variable).
Shape Menu of the Overlay (or Static)
In addition to the Clipboard and Font system sections, the following tools are also available in this menu:
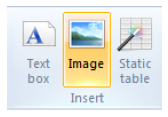
Insert:
- Add and position a zone which contains static text. This text can then be formatted using the associated formatting options.
- Add and position a static image (such as a company logo).
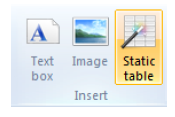
- Add, parameter and position a static table by defining the number of rows, columns, the outline and their formatting, as well as the title of each row / column, …
Shapes:
- Standard drawing palette to add lines, curves, squares, rectangles, rounded rectangles, circles, ellipses, as well as some preset shapes.
Styles:
- Formatting options related to each of the previous elements: style and colour of the outline, filling style and colour, line thickness.
Generate:
- This option is specific to components and is used to generate them.
Shape Menu of the Dynamic view
In addition to the Clipboard and Font system sections, the following tools are also available in this menu:
Data:
These tools are used to process source file data (spooled file). There are two types of tools:
Group:
- Adds, parameters and positions groups of data: fixed and variable groups.
- Also adds anchors used to position variable groups.
Zone:
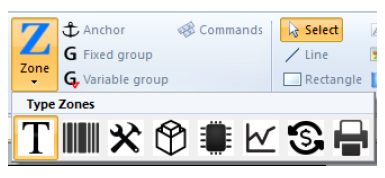
- Adds, parameters and positions data recovery zones.
Insert:
- Inserts other dynamic elements, in addition to the data from the spooled file: straight lines, rectangles, text zones input using the keyboard, dynamic images, graphs...
- Adds components and/or variable elements which were designed elsewhere in the project.
"Quick access" toolbar
The title bar of the application features a shortcut bar, or toolbar, called "Quick access:
The tools and features accessible in this zone are completely configurable according to user habits.
To add a feature in the Quick access zone, you need to find the feature using the menus and then, right click and select "Add to the Quick access toolbar" as shown below:
The new feature is then displayed in the title bar:
To delete a feature from the Quick access zone, right-click on it and select Delete from the Quick Access toolbar.
The drop down menu on the right of this zone allows you to customize the features accessible as well as how they are arranged, using the Customize the Quick access toolbar section (display order, add separators):
Creating a project
Project
A Designer project is made up of an overlay, which is the static part of the template, and a data file, which is the variable or dynamic part. A project is identified by a specific format name and sequence number which make it unique within the production server..
On a PC Drive or Network share, a project is made up of three files (or five in the case of a double-sided project):
- A .mpw file with the overlay in simplex (another one for the duplex if necessary)
- A .mpi file with the data formatting in simplex (another one for the duplex if necessary)
- A .mpp file identifies the project and associates it with the other .mpw and .mpi files.
The project term is only used as the template is designed in Designer. Once it is generated on the server, we refer to it as a format and a sequence number.
Creating a project
To create a new project, go to the File menu > New > Project.
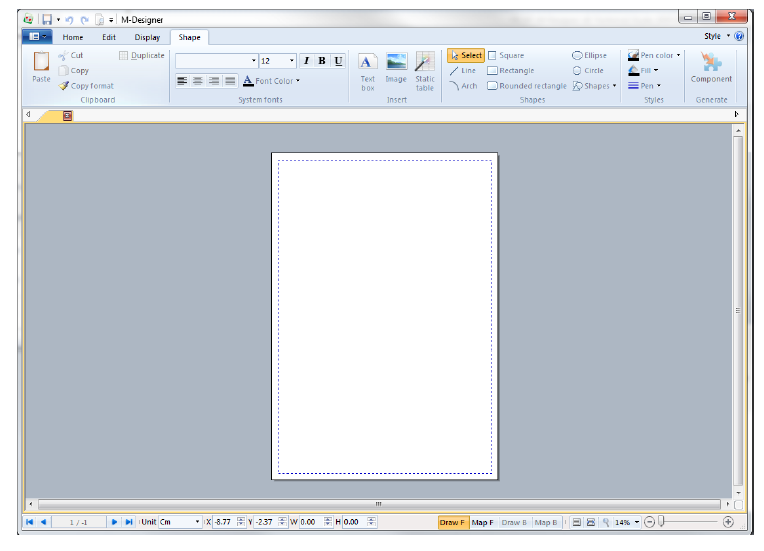
The designing view then displays the project as a blank page with default parameters (portrait, A4, simplex).
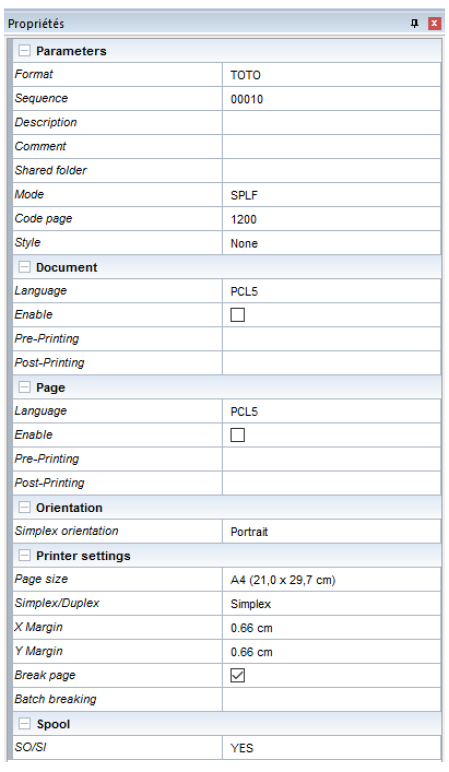
In the Display tab, we recommend you to check the Properties box in the Show/Hide tab, a window on the right part of the screen appears displaying all the properties to define.
First, you must specify both of these parameters:
- Name of the format = ID of the format with ten characters maximum.
- Sequence = numerical ID of the sequence with five characters maximum.
Formats and Sequences will be explained in further details below.
Other properties can be configured in this panel:
- Description= user information (limited to 25 characters maximum).
- Comment = additional information.
- Destination = generation path of the project (also defined in Preferences).
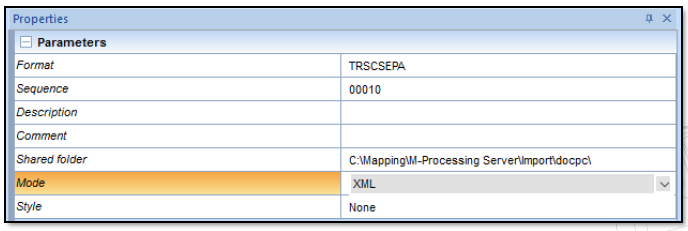
- Mode = type of data to format: SPLF (text) or XML.
- Code Page = to open a non-Unicode spooled file with an XPS template specifying the file code page in the project properties. This option can only be accessed in SPLF mode.
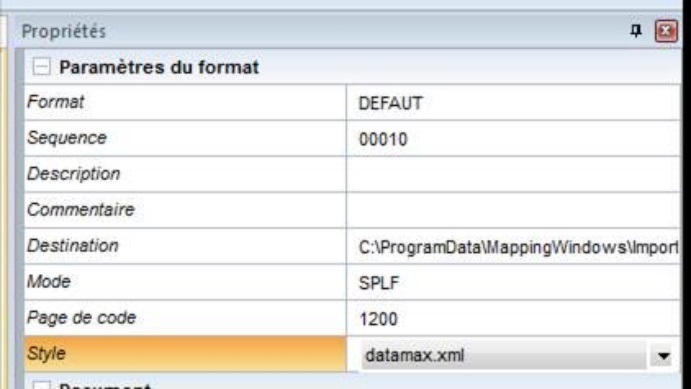
- Style = selection of the style sheet (also defined in Preferences). This option is explained in further details below.
- Document and Page = allows you to add data in printer language in the output datastream for the following languages: PCL5, APFDS, PDF, ZPL, DPL, TEC, IGP, IPL and EPL. A zone can include data from different languages. When the XPS file is converted to the output language, the data corresponding to the output language is used. Data is specified at the beginning and end of the document.
- Orientation = portrait or landscape fr the simplex and potentially the duplex side.
- Page size (ISO standard formats or customised format) and margins.
- Selection of a simplex or double-sided project (flip the page on the long or the short edge).
- Page break = default setting of the application as it processes data one page at a time and adds a page break once the data of a page has been completely processed. If the break is deactivated, the data of the following page will be placed after that of the page processed.
- Batch breaking = defines a Metadata type zone which will be used to group the pages of the final document together (see 8.8.a. Pagination management by batch breaking).
- Position = if the page break is disabled, this option allows you to specify the position of data on the following page, i.e. to the right of the current page (horizontal shift) or below (vertical shift).
The SO/SI property is used under Windows and Unix to reproduce a native function under iSeries, i.e the EBCDIC spooled file management containing both SBCS and DBCS characters (in particular Asian and Japanese spooled files). This property notifies the application of the detection mode and rendering of the Shift Out and Shift In information (non-printable 0x0F and 0x0E hexadecimal characters) framing the DBCS texts to comply with the spacing between the characters regardless of their width.
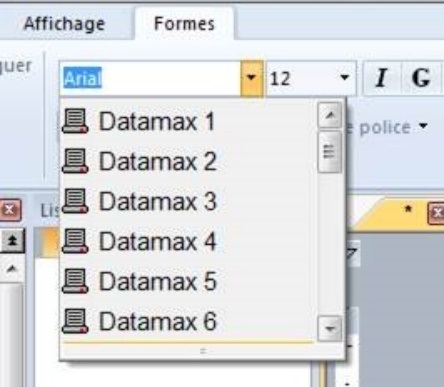
In detail, the Style option both limits the number of fonts which can be used in a template and renames these fonts using an alias. For instance, this simplifies the use of resident fonts in a template by renaming the TTF fonts installed on the workstation with the name of the resident fonts of the target printer.
The generated XPS file embeds the new name of the fonts as defined in the style, these names can therefore be used to define alternative fonts in the conversion profile.
Example of a style to print on a Datamax printer:
<?xml version="1.0" encoding="windows-1252" ?>
<style>
<fonts>
<font name="Arial" alias="Datamax 0"/>
<font name="Arial" alias="Datamax 1"/>
<font name="Arial" alias="Datamax 2"/>
<font name="Arial" alias="Datamax 3"/>
<font name="Arial" alias="Datamax 4"/>
<font name="Arial" alias="Datamax 5"/>
<font name="Arial" alias="Datamax 6"/>
<font name="Arial" alias="Datamax 7 (OCR-A)"/>
<font name="Arial" alias="Datamax 8 (OCR-B)"/>
<font name="Arial" alias="Datamax 9 (Arial)"/>
</fonts>
</style>
Designer comes with the following styles by default: Datamax, Eltron, IGP, Intermec, TEC, and Zebra so that older non-Unicode templates can be re-used.
The selection of these styles is automatic when opening an older template.
The project is now ready to be developed.
Format/Sequence
A Format, viewed in Onyx Server, is the equivalent of a Designer project but once it was generated and imported on the production server. The same format can be composed of several sequences.
Every Sequence is conditioned to run on different pages of a data file (spooled file or XML file).
Here is an example to better understand the benefit of having several sequences for one project:
On an invoice with 3 pages:
- The first page includes the recipient's address, the sender's address as well as the start of the invoice table (Page type 1)
- The last page includes the total of the invoice (Page type 2)
- All the other pages contain the body of the invoice (Page type 3)
Processing the spooled file with the same format is difficult since formatting can differ depending on the page type. Three formats will then be created, one for each page type.
These three formats will have the same name because the three together make THE document "invoice" template, however they will have different sequence numbers:
- Sequence 00010 runs on page type 1.
- Sequence 00020 runs on page type 2.
- Sequence 00030 runs on page type 3.
When running the invoice format on a data file, a MERGE of these sequences is carried out to process the spooled file entirely.
Overlay (Draw Tab)
Definition
An Overlay is made up of all static and dynamic elements of a Designer project. It can be compared to pre-printed pages in the printing industry.
The Draw F part is the one used to design overlays, you can access it by clicking on the corresponding tab in the status bar. Selecting this tab gives you access to the "Overlay" toolbar in the "Shape" menu.
If you are working on a double sided project, use the Draw B tab to design the overlay for the duplex.
Elements of an Overlay
Geometric Shapes
To draw a geometric shape, select the corresponding icon in the Shape tab. Hold the button of your mouse down and drag your mouse to define the shape and place it on the page. Give it the height and width you would like by dragging your mouse. Then, release the mouse button.
Once the shape is drawn, you can select it, move it around and change its properties (size, outline, filling).
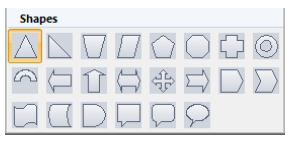
Designer also features a variety of preset, more complex shapes you can select by clicking on the Shape icon:
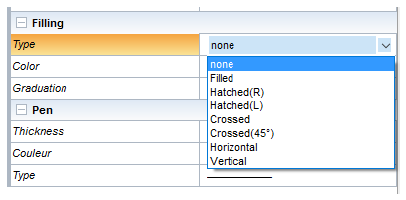
Different types of shape fillings are available in the object properties:
Texts
To insert a text box, select the Text icon then hold the button of your mouse down where you want the box to be placed. Using the same method as with the geometric shape, drag your mouse to adjust the height and width of the box. Once you have released the mouse button, write your text and format it as you wish (font, size, colour, bold, aligned / justified…).
Images
To insert an image, select the Image icon and hold the button of your mouse down where you want the image to be placed. Give it the height and width you would like by dragging your mouse.
Once you have released the mouse button, a windows opens and asks you to select the Image file you want to insert. All you need to do is select the right file.
The image you selected will then be added to the overlay of the project. You can choose to keep the original dimensions of the file or alter them.
Static table
Using this tool, you can insert a static table into the overlay, you will have to define its properties upon creating it.
To add a static table, select the Static table icon and hold the button of your mouse down where you want the table to be placed. Once you have released the mouse button, a window opens and asks you to define the various parameters of the rows and columns such as their height, position, number, colour, titles...
Tables can also be inserted without specifying the dimensions beforehand, to do so follow the process detailed in 8.5. Draw a table.
Dynamic Part (Map Tab)
Definition
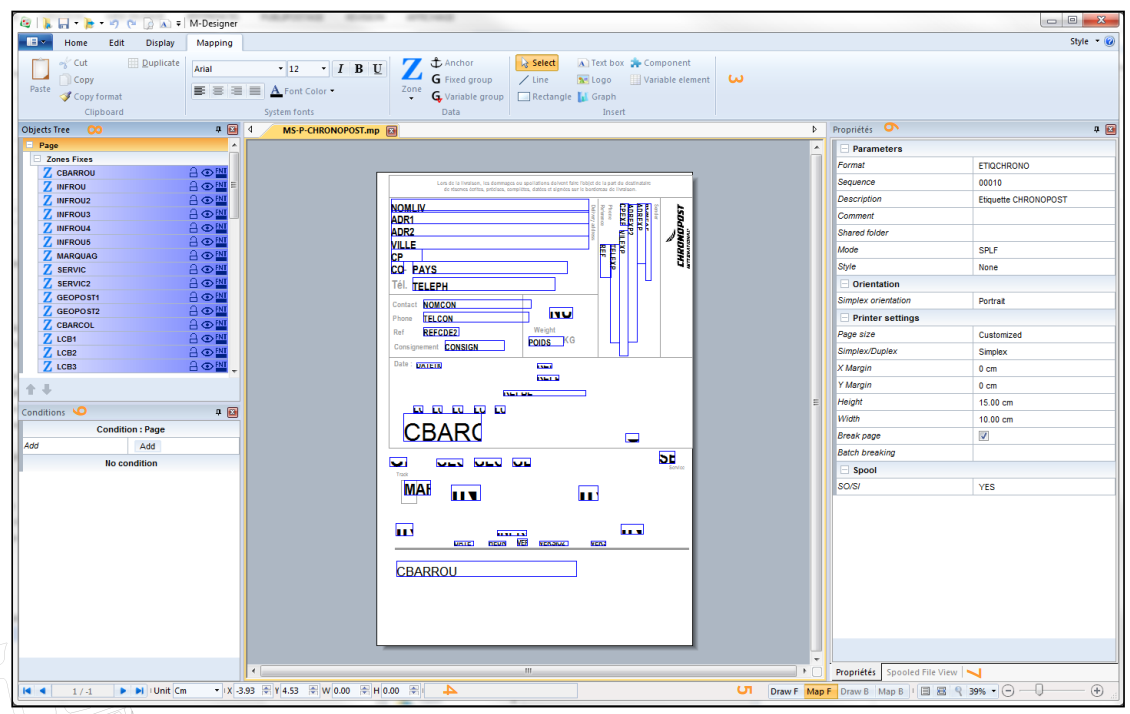
The Map part of a project corresponds to the dynamic part of designs that are made according to the datastreams processed by the template. The main elements which can be placed in this part are data files printable information.
To design this part, select the "Map F" tab (and "Map B" for the duplex of the document). In this view, elements of the "Draw" part are displayed as watermarks so that positioning the data to be printed is easier.
"Spooled File"
To retrieve and identify data to be printed, designing a Designer project is done using an example file. This example file is an image of the production spooled file to format.
Designer supports two types of data files in native mode: paginated text files and XML files in Mapping format. Input file types are configured in the project properties.
Designer processes files with .PAG or .TXT extensions. Text files usually have a ".PAG" extension because they need to be paginated. Text files can be paginated by running the "MAPPAGIFS" command in Onyx Server where an argument specifying the number of lines per page ("Overflow") will be given.
XML files need to respect a particular syntax so that the application can properly process them. (see 6.3 XML Mode: syntax and specifications).
To open and display an example file in DESIGNER, the spooled file view needs to be activated in the Display Menu:
In the "Home" tab, click on and select the file you want to load in the application.
The spooled file view then displays the data from the spooled file to format.
To help you design your project, you can preview the result without having to print the document. To do so, click on the Preview button in the Home menu.
XML: syntax and specifications
In XML mode, the design principles are the same and are put in application using an example file loaded in the application.
As stated in 4.2. Creating a project, to load a .xml document, it is important not to forget to go to the project Properties and check that in Parameters > Mode = XML.
The Spooled file view is then called the XML view and displays the content of the file in a tree view.
Data structure
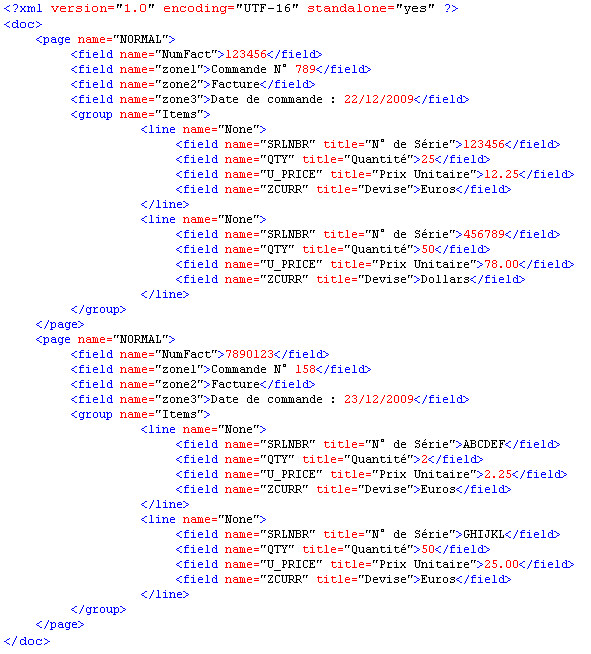
XML files that are processed by Designer in native mode have to respect a specific pattern and syntax, such as:
<page name="..."> … </page> tags mark out the pages of the document. In the last example, there is only one page.
- <field name="...">value1</field> tags correspond to unit-based information (the equivalent of ‘zones’/'fields' in Designer).
- <group name="..."> … </group> tags refer to a particular number of lines which contain zones, such as a ‘group’ in Designer.
- <line name="…"> … <line> tags correspond to the lines inside of these groups.
If we were to use this structure with a paper invoice:
- <page name="..."> … </page> corresponds to the pages of the invoice.
- <group name="..."> … </group> marks out the body of the invoice (from the first line to the last).
- <line name="…"> … <line> describes every line in the body of the invoice.
- <field name="...">value1</field> can correspond to two things:
- If this tag is on the outside of a group, it corresponds to unit-based information in the invoice. In which case, value1 corresponds to the invoice number in the header, for instance, or to the client number, the type of invoice, etc.
- If this tag is inside a group, value1 corresponds to the value of the zone in the line. For instance, the product code, its name, price, etc.
XML pattern specifications
The specifications needed for Designer to process the file are the following:
The XML header needs to specify the file encoding.
Example : <?xml version="1.0" encoding="UTF-16" standalone="yes" ?>
The root tag of XML data needs to be called doc.
All tags mentioned hereafter need to have at least one attribute named name. Information will be identified, retrieved and formatted by the application via the use of this attribute.
The tags and attributes names are case-sensitive and need to be written in lowercase letters.
For the application to access it, data must be placed in pages in between the <page name="…"> and </page> tags. One document can contain several pages.
Inside a page, data is organised per unit-based fields (balise <field name="…">) or per information groups (balise <group name="…">).
Information groups are composed of lines (balise <line name="…">).
The lines contain unit-based informations (balise <field name="…">).
Here is an example of an XML file:
XML data can be placed on the outside of a page as information linked to the overall document and not to the page in particular. However this data will not be accessible to Designer and thus cannot be processed to design the document. Nonetheless, this data can be used in the M-Processing Server engine.
XML view in Designer
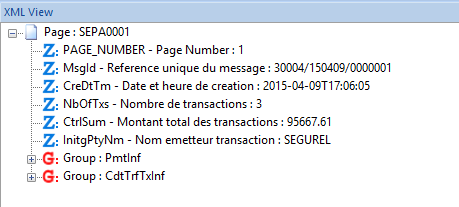
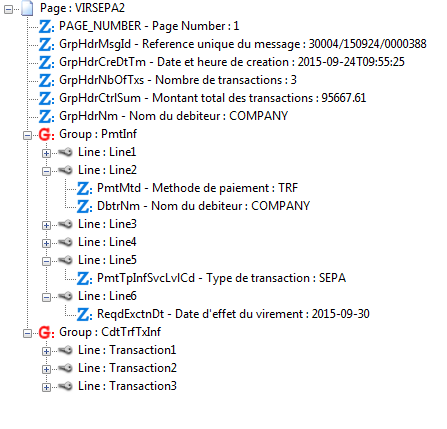
An XML example file is loaded in DESIGNER in the same way that is use to load a text file. In the XML view, data is displayed as a list of elements.
Page break on an XML field value
In the Proprieties of a group, generating a page break can now be triggered based on the change in value of the XML field.
For example:
<group name="groupe">
<line name="ligne">
<field name="id">1</field>
<field name="data"> data </field>
</line>
<line name="ligne">
<field name="id">1</field>
<field name="data"> data </field>
</line>
<line name="ligne">
<field name="id">2</field>
<field name="data"> data </field>
</line>
<line name="ligne">
<field name="id">2</field>
<field name="data"> data </field>
</line>
…
</group>
In this example, if the field used to generate a page break is the field "id" then the page break will be generated after the execution of the second line.
There are several options in the interface for the Page break parameter:
- None: the group does not generate any page break.
- Limit: the group triggers a page break based on a positioning limit.
- XML Field: the group triggers a page break based on the change in value of an XML field.
- Limit and XML Field: the group triggers a page break based on a positioning limit and on a change in value of an XML field.
When generating automatic page breaks, managing the recovery of headers is possible with the options "Header" and "Last header":
- Header: to choose the name of the line of the XML file which acts as header.
- Last header: if checked, only the last header is kept. The box is checked by default.
When generating a page break, the last header (or all of the above headings, if the option is unchecked) are used at the start of the new page.
In the XML file, if two header lines follow each other, they are considered as one single header.
If a page break is triggered just after a header line, that header line is not printed and is moved to the next page.
f
To display a list of items in an XML group as a table, the script tool must be used.
The rowtotable feature rearranges the lines of a group so as to obtain a horizontal distribution of the elements.
Syntax:rowtotable(name of the group, maximal number of columns in the table);
The rowtotable feature has two settings:
- Name of the group: contains the name of the group to be reorganized in a table, framed by double quotes.
- Maximal number of columns in the table: Maximal number of columns in the table.
Note: All the lines of a group should have the same name.
For example:
<group name="invoice">
<line name="item">
<field name="name">item 1</field>
</line>
<line name="item">
<field name="name">item 2</field>
</line>
<line name="item">
<field name="name">item 3</field>
</line>
<line name="item">
<field name="name">item 4</field>
</line>
<line name="item">
<field name="name">item 5</field>
</line>
<line name="item">
<field name="name">item 6</field>
</line>
<line name="item">
<field name="name">item 7</field>
</line>
<line name="item">
<field name="name">item 8</field>
</line>
</group>
To rearrange this group in a three-column table, use the following script:
rowtotable("invoice",3);
This script will effectively change the group which then becomes:
<group name="invoice">
<line name="item">
<field name="name_1">item 1</field>
<field name="name_2">item 2</field>
<field name="name_3">item 3</field>
</line>
<line name="item">
<field name="name_1">item 4</field>
<field name="name_2">item 5</field>
<field name="name_3">item 6</field>
</line>
<line name="item">
<field name="name_1">item 7</field>
<field name="name_2">item 8</field>
</line>
</group>
Dynamic elements
This part of the documentation presents the basic elements that can be added in the dynamic part of a project in order to get started with the main features of the application.
Zone
Definition
A zone is the main element, which allows you to retrieve information in the input data in order to position and format them in the final graphical document.
In text mode, the information is identified by the following three elements of data:
- a row number,
- a column number,
- a length.
In XML mode, it is identified by the name of the XML field (field tag).
A zone can only read one row at a time.
It is represented in the following two ways in the designing space:
- The zone is empty, no data is associated with it: an icon appears in its upper right corner.
- The zone is associated with an element of data, it appears without an icon.
A zone is identified by its name, defined in the properties window (see a.2 Creating a zone for more details).
Creating a zone
There are two methods you can use to create a zone:
Select the corresponding icon and its type in the Data tab and hold the button of your mouse down where you want the element to be placed. This method creates an empty zone. To link the zone to an element of data from the source file, select the data in the spooled file view (see the second method below) then, drag and drop it in the zone which was created previously, by holding down the Ctrl key.
Select the data to be recovered in the Spooled file view then, drag and drop it where you want, in the designing space to create a zone automatically linked to the data you selected.
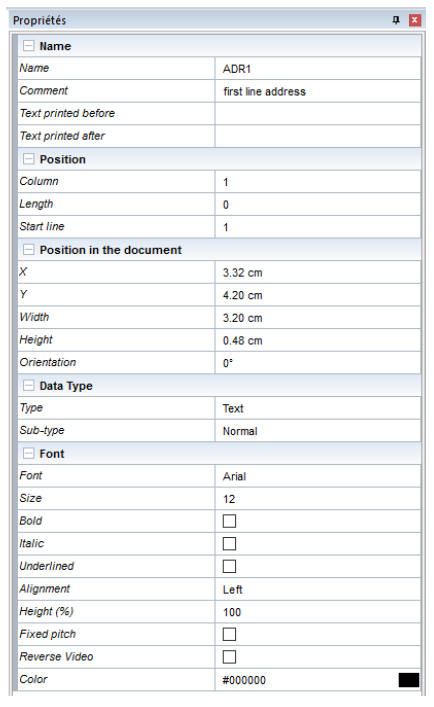
Once the zone has been created, select it and display the 'Properties view to fill in the following information:
Name :
Name (of the zone): this information is used as internal information in Designer, it identifies the different objets in the project. When creating the zone from the data tab, this field is empty, its value is given by the data linked to it from the Spooled file view.
Text printed before/after: to add text before and/or after the retrieved information.
Position :
Position of the information in the data spooled file: column, length, beginning line.
This is also used to extract a certain quantity of information in XML mode.
Position in the document:
to change the position of the zone on the page.
Data Type:
defines how the Designer application processes the information retrieved (see a.3 Types of zones).
Font:
To set all formatting options: font, size, colour, framing, orientation, etc.
Types of zones
The Designer application offers various processing options according to the type of data to process:
- Text: prints plain text.
- Normal: copies the values located in the positions defined by the zone whether they are letters, numbers or blanks.
- Optimized: copies the characters located in these positions except for blanks at the beginning and end of these positions. The framing to the left or to the right is always observed. There is no shift due to blanks in the spooled file.
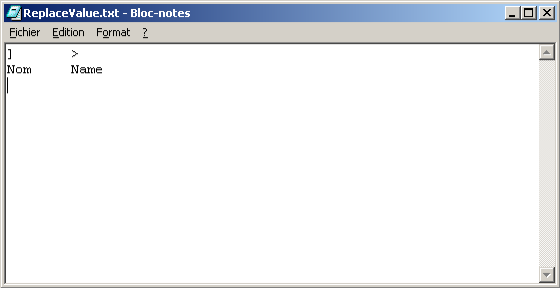
- Substitution: used to replace a value of the spooled file with another one stored in a file called replacevalue.txt. By default, this file is in its blank state in the Designer installation folder. To carry out the substitutions, place it in the lgobitmap folder. The folder needs to contain the values to be replaced followed by replacement values and separated by a tab. This sub-type is explained in further detail in 8.3. Replacing characters.
- Translate: substitutes a value for its translation in another language. A zone type Tools / Set Lang is used beforehand to define the file with the translated values. The program searches for the corresponding input in the translation file for each Text / Translate zone which is defined in the template. The file must be placed in the lgobitmap folder and its name must start with "Translate_".
- Compressed: zone displaying the recovered text into the dedicated space. The text occupies the width of the zone and adjusts the font size between a maximum and a minimum so that the text covers all the dedicated space.. If the minimum font size does not display the entire text, it is truncated and followed by "…".
- Truncated: zone displaying the recovered text into the space allowed by the zone width. If the text cannot be fully displayed, it is truncated followed by "...".
- Barcode: encodes and prints barcodes. The list of available barcodes can be seen in 8.1 Barcodes
- Tools: inserts a page number, images, … but also displays the total number of pages, pages in the current batch, …
- Page Number: numbers each edited page. The page number is not necessarily the same as that in the original spooled file. If M-Processing Server is set to exclude certain pages, the number of edited pages will not necessarily be the same as the number of pages in the original spooled file.
- Batch Number: displays the batch number.
- Page Number (Batch): displays the page number in the batch.
- Total Number of Pages: displays the number of pages in the document.
- Total Number of Batches: displays the number of batches in the document.
- Total Number of Pages (Batch): displays the number of pages in the current batch.
- Specific replacement: replaces a value in the spooled file processed by another value which was retrieved in a file. For example, the customer number displayed in the spooled file can be replaced with the customer's name which is retrieved in a database file.
- Image: prints out a different image depending on the value of the spooled file.
- Export: this type of zone allows you to retrieve information from the spooled file and export it to a physical file.
- Repl. File: retrieves text in a file. The name of the zone must correspond to the name of the file. The file must be in the lgobitmap folder and be called data_NAMEOFTHEZONE.txt (where NAMEOFTHEZONE is the real name of the zone). The row and length settings of the zone indicate the row and length of the text to be retrieved.
- Input Text: creates interactive input fields to design SOAP forms in PDF or HTML format. As the user opens the form generated in Adobe Reader or a web browser, he can fill in input fields and send data to an M-Processing Server URL in a Web entry point by clicking on the SUBMIT button, which is actually a Tools / Input Text zone called SUBMIT (system name).
- HyperLink: adds a URL link.
- Set Lang: to specify the file which contains the translations. The latter must be in the lgobitmap folder and its name must start with Translate_. This zone is not printed in the final document, it cannot be seen for preview nor mapping. The name of this zone is not really important, however it must be declared before any other Designer zone that requires translation. Then, the program searches for the corresponding input in the translation file for each Text / Translate zone defined in the template.
- XPS Message: Inserts an XPS file in the current page. This zone is a link to an XPS file which is on the M-Processing Server. This file must only contain one page and must also be placed in the lgobitmap folder (directly or in a sub-folder). It is not case sensitive. If changes are made to the XPS file, it will impact the projects that use it.
- XPS File: unlike XPS Messages, the files inserted with XPS File zones:
- can contain several pages.
- are whole pages.
- create additional pages in the output file.
- Metadata: indexes the document for archiving (non printed data). The length of the metadata is unlimited.
- Index: index zone by default, used in XPS manipulations and in M-Storage Manager as criterion.
- MapFrom: index reserved to send emails. The value of this zone will be used to specify the email sender.
- MapSend: index reserved to send emails. The value of this zone will be used to define the address of the recipient.
- MapCopy: index reserved to send emails. The value of this zone will be used to specify the copy recipient.
- MapBCopy: index reserved to send emails. The value of this zone will be used to define the recipient in hidden copy.
- MapNote: index reserved to send emails. The value of this zone will be used to define the body of the email.
- MapSubject: index reserved to send emails. The value of this zone will be used to define the mail subject.
- MapOrg: index reserved to send faxes. The value of this zone will be used to identify the sender.
- MapTo: index reserved to send faxes. The value of this zone will be used to define the recipient.
- MapUser: index reserved to send faxes. The value of this zone will be used to identify the owner.
- MapFormat: index reserved to send faxes. The value of this zone will be used to define the document format (.BMP, .JPG, .EXE, .PAG, .PDF, .TIF, .TIF_FAX, .TXT, .XLS).
- Memory: inserts and stores information (not printed) which will later be recovered and used in the template. (see 8.1.b. Combined data)
- Text: saves alphanumeric information and deletes the spaces after the text.
- Text with spaces: saves alphanumeric information and keeps the spaces after the text.
- Integer: saves integer-type digital information.
- Float: saves floating-type digital information.
- SQL: saves alphanumeric information found in a database using an SQL query.
- Protect SQL: saves alphanumeric information found in a database using a protected SQL query.
- Math. calculation: uses memory zones to perform a calculation.
- Memory Replacement: retrieves information saved in the memory zone.
- Memory Translate: saves alphanumeric information resulting from the automatic translation of the information retrieved in the spooled file.
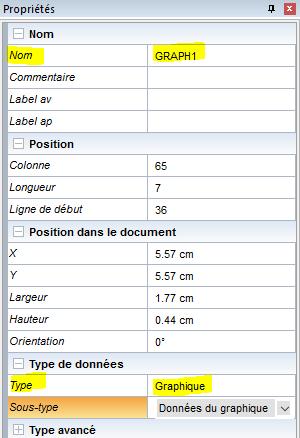
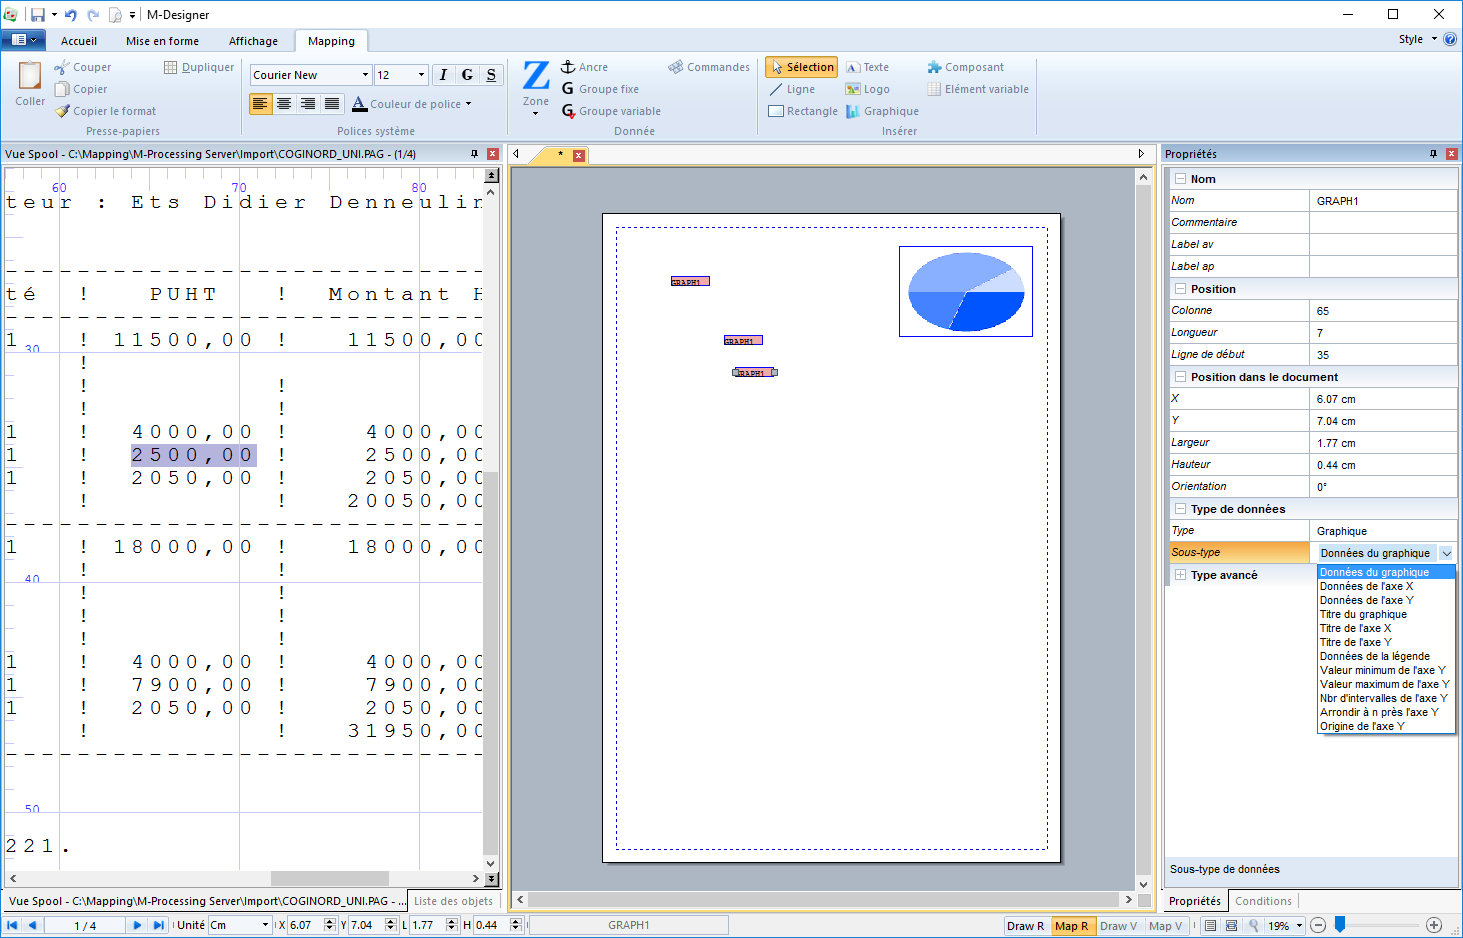
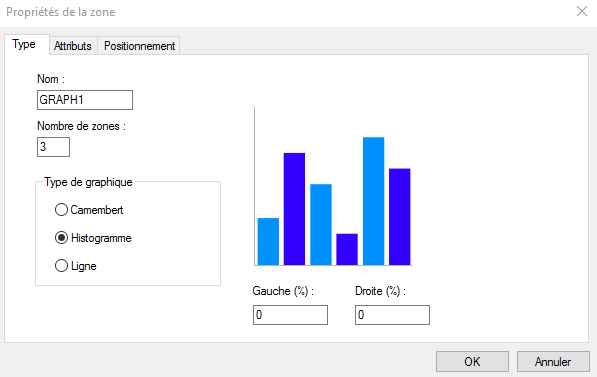
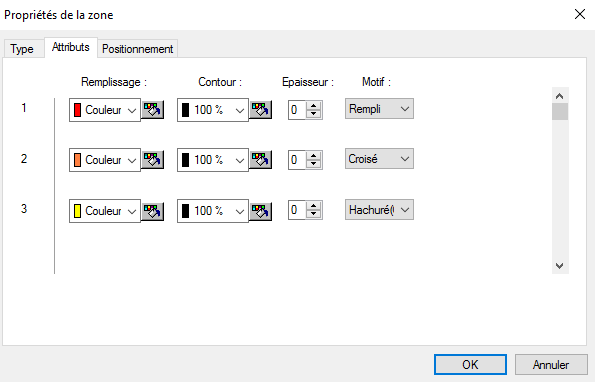
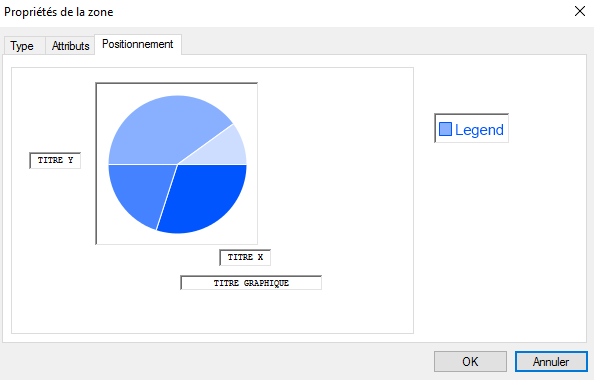
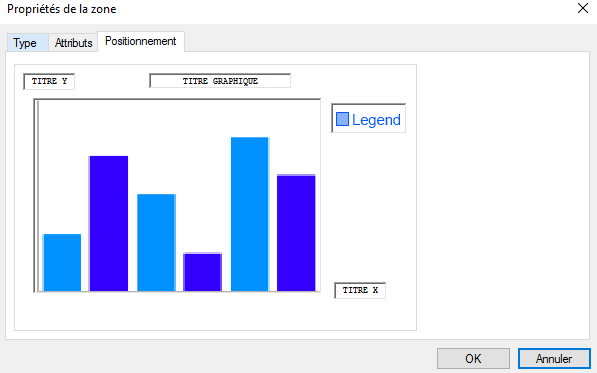
- Graph: used to generate a graph using multiple elements of data
- Graph data.
- X-axis data.
- Y-axis data.
- Graph title.
- X-axis title.
- Y-axis title.
- Legend data.
- Minimum value of the Y-axis.
- Maximum value of the Y-axis.
- No. of intervals of the Y-axis.
- Rounding up/down to the nearest integer number on the Y-axis.
- Intercept of the Y-axis.
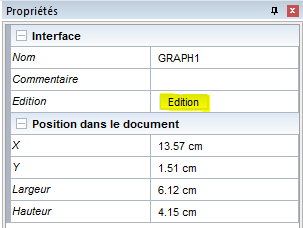
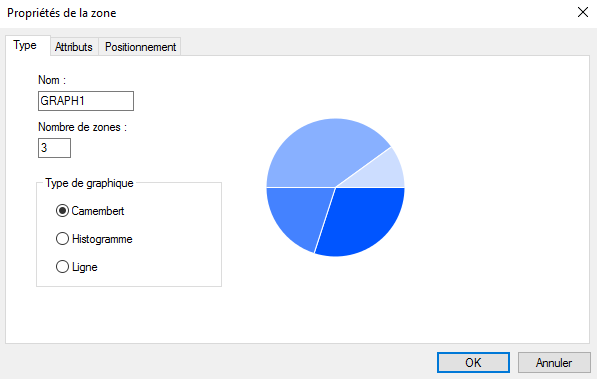
The construction of a graph is detailed in section 8.6. Drawing a graph.
Designer can automatically convert old graph types in complex graphics. This feature facilitates the conversion of old projects in XPS projects.
- Conversion: converts numerical data according to conversion rules (Euro to Dollar for example) defined in Onyx Server > Managing Designer Formats > Managing Rates (01=E1 ; 02=E2 ; …)
- XPS PrintTicket:
- Copy: number of copies to print.
- Input Bin: input bin number (printer paper feed).
- Output Bin: output bin number.
- Media Type: Type of paper (A4, A5, etc...).
- Force Front Side: determines the mode Simplex/Duplex when printing.
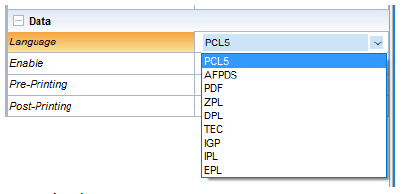
- Commands: adds data in the print stream, in printer language. As for the project properties, Document and Page (see 4.2. Creating a project), a "Commands" zone defines the printer language data for the following languages: PCL5, APFDS, PDF, ZPL, DPL, TEC, IGP, IPL and EPL. A zone can contain data for several different languages. When converting the XPS to the output language, the corresponding data to the output language will be used.
Language: select language.
Activate: enable zone for the selected language.
Pre- and Post-Printing: Data written before and after the retrieved data from the spooled file.
Writing hexadecimal data in the "pre-" and "post-printing" can be done using the following syntax: \x followed by the hexadecimal value of two characters.
Groups
Definition
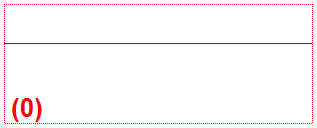
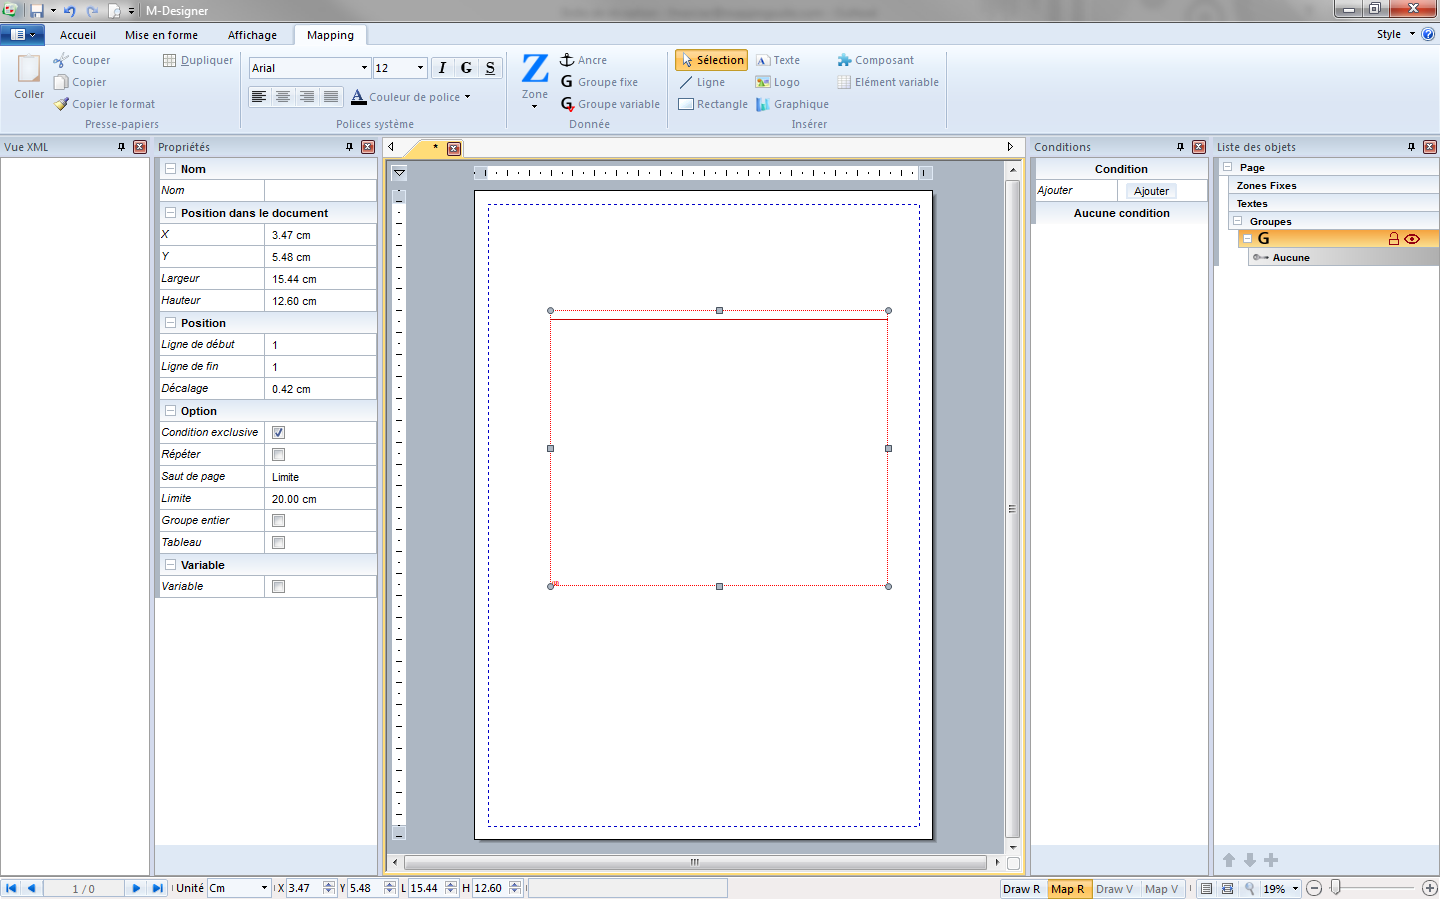
A group can be used to retrieve several rows of a spooled file. It is defined by a beginning row and an end row. It is shown in red in the designing space:
A group can be fixed (fixed beginning and end rows) or variable (variable beginning and end rows).
Creating a fixed group
The creation of a fixed group, is similar to the creation of a zone.
- Create an empty group from the Ribbon menu, select the data of the source file, drag and drop it in the group you created beforehand while holding down the Ctrl key.
- Select data in the Spooled File view, use the drag and drop method to place it in the designing space to create a group automatically which is linked to the zone you selected in the spooled file.
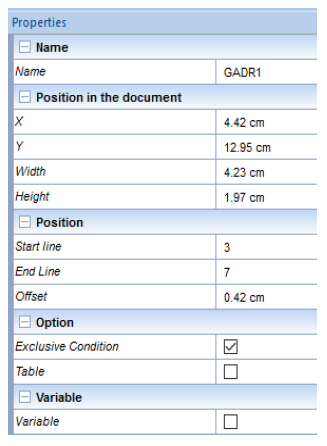
Once the group is created, its informations must be specified in the Properties view:
Name:
- Name (of the group): this information is used as internal information in Designer, it identifies the different objets in the project. When creating the group from the data tab, this field is empty, its value is given by the data linked to it from the Spooled file view.
- Position in the document:
- Used to change the position of the group on the page.
- Position:
- Identifies the beginning and end rows in the block of information to recover.
- Offset: prints the position of the first row in relation to the group
- Option:
- Exclusive conditions: For one row of the group, a true condition will be executed exclusively without testing the following rows
- Table: allows zones of a group to behave like the cells of a table. Zones of the same line find themselves automatically linked. Resizing or moving a zone impacts the size and the position of the adjacent zones. In addition, the group's lines (or conditions) are visually represented in the designing window. The zones are vertically distributed according to their line. This option is detailed in 8.5.b. Drawing a dynamic table.
- Variable:
- Used to change the type of group: from fixed (the beginning and end rows are static) to variable (the beginning and end rows are variable and defined by conditions).
If the user requests a preview, no information will be printed. Indeed, a group only defines the limits between which the data is to be retrieved from the spooled file.
Given that the limits of the data selection zone are defined using the Beginning line and End Line fields of the group, the data must then be retrieved by creating one or more Zones inside the group.
In short:
- The selection zone of the data block is configured by creating a Group:
The data is retrieved inside this block of data by creating a Zone:
- All the rows of our block of data are retrieved using the preview function (Ctrl+w). Several Zones can be created from the data block, they can then be placed in the group and their formatting can be conditioned (see 6.4.c. Conditions).
Creating a variable group
A variable group uses the same principles as a fixed group i.e. it can be used to retrieve several rows of information in the spooled file. A variable group is used when the beginning or end row of the group is not always at the same place in the spooled file or if you do not want the information to always be printed at the same place on the page.
A variable group uses a start condition and an end condition. The group begins to run when a condition is validated and it stops when another condition is validated or when it has executed a certain number of rows. A variable group can be executed once or more times in the page.
The position of the values printed by a variable group can be variable.
For example, you can define the settings so that the values printed by a group are positioned after the values printed by another group. We refer to this as relative positioning.
You can also define the settings so that the invoice total is always printed one centimeter after the last product row (whether there are 5 or 20 rows). The position of the invoice total will therefore change according to the number of product rows in the invoice, for instance.
A group may vary in:
- size: the beginning and end rows are dynamically set by the conditions,
- print position: variable groups can be linked one after the other so that the following group is printed straight after the current group has been printed.
These two types of variable can exist separately or jointly.
To create a variable group, simply click the icon and draw the group in the designing space.
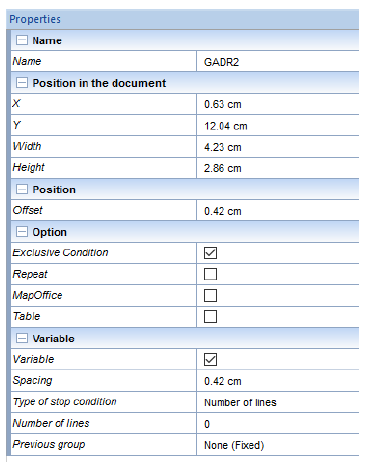
The Properties view is displayed so that the group information can be entered:
- Name:
- Name (of the group): this information is used as internal information in Designer, it identifies the different objets in the project. When creating the group from the data tab, this field is empty.
- Position in the document:
- Used to change the position of the group on the page.
- Position:
- Offset: prints the position of the first row in relation to the group.
- Option:
- Exclusive conditions: for a row of the group, a true condition will be performed exclusively without testing the following rows.
- Repeat: if the start condition appears several times, the group will run several times provided that the end condition has been validated in the meantime.
- MapOffice: used to check the design of a MapOffice group (see the Connect documentation on designing Office documents).
- Table: allows zones of a group to behave like the cells of a table. Zones of the same line find themselves automatically linked. Resizing or moving a zone impacts the size and the position of the adjacent zones. In addition, the group's lines (or conditions) are visually represented in the designing window. The zones are vertically distributed according to their line.
- Variable:
- Used to change the type of group: from fixed (the beginning and end rows are static) to variable (the beginning and end rows are variable and defined by conditions).
- Spacing: spacing before the printing of the group.
- Type of stop condition: used to condition the end of the execution of the variable group.
- Previous group: Indicates after which fixed group the variable group is run.
Conditions
Execution conditions
Execution conditions are used to execute, or not to execute, the object conditioned in accordance with a value in the spooled file.
A condition can apply to a page, a component, a group, a zone, a line or a rectangle.
If the condition is valid, the object is executed. Otherwise, no further action is taken. In order to complete two different actions depending on the presence of a spooled file value or not, you must create two objects.
Example: If you want to write in black for an Invoice value and in red for a Credit Note value in a spooled file row, you need to create two zones. One with a black font when the value is Invoice, and one with a red font when the value is Credit Note because you cannot apply two conditions to the same particular zone: "black font if Invoice and red font if Credit Note" is not possible.
The conditions are managed differently if the object is fixed or if it belongs to a group. Indeed, in a group, the condition is named and linked to the group. Therefore, we can associate multiple objects to a single condition without having to re-enter the latter each time.
Start condition
The start condition defines the first row for the execution of the variable group. The group begins to run on the row where the start condition is true.
Onyx Server tests the validity of the condition from the first row of the spooled file (row 1). As soon as the condition is verified, the group begins to run. It stops when the end condition is also verified.
The start condition is also used to define if the group is to be printed at a fixed position on the page or in relative positioning in relation to another group. It is also possible to set it so that the group is printed one centimeter after the end of an other group.
If the start condition for the group is not verified on any of the rows of the spooled file, the group is not executed.
If the start condition is verified on several rows of the spooled file, the group runs only once: from the first row where the condition is verified.
End condition
The end row of a variable group can be defined in two ways:
- number of execution rows,
- end condition.
By knowing the number of rows for which the variable group must run, it is possible to set the input number after you have checked the Number of lines box.
The stop condition does not consist in a comparison test in relation to a value present in the spooled file but in a comparison test in relation to the row number after which the group stops.
The end condition defines the last row for the execution of the variable group. The group stops running on the row where the end condition is true. This row can be excluded (non executed) or included (executed).
Exclusive condition
In a group, it is possible to manage several conditions. By default, there is only one which is the None condition that applies for all newly created zones. That condition is always TRUE (valid).
Example:
In a group containing product rows, there may be rows of sub-totals. It is possible to use several zones to print these different types of rows (to display the sub-totals in bold for example) using a condition.
In this case there are basically two conditions: a Sub-total condition, which is linked to at least one zone that prints in bold and the None condition, which is linked to the zone that has standard writing for the product rows.
If the group operates using exclusive conditions, one single condition is applied per row, even if several are true (only the first created condition is applied). The product rows are printed as standard by the zone under the None condition and the rows of sub-totals are printed in bold by the zone under the "Sub-total". condition.
If the group operates using non-exclusive conditions, all the verified conditions are applied by row. In this case, the sub-total rows are printed twice, once in bold by the zone under the Sub-total and once as standard by the zone under the None condition. Indeed, the None is always true as mentioned before.
If the group operates using non-exclusive conditions, all the verified conditions are applied by row. In this case, the sub-total rows are printed twice, once in bold, by the zone with the Sub-total condition and once in standard setting by the zone with the None condition. Indeed, the None condition is always true as mentioned before.
The None condition cannot be deleted. If you do not want to use it, do not link it to an object.
Comparison type
When setting the conditions, you can test:
The existence in the row: there is in a row or in the entire page.
The non-existence in the row: There is not in a row or in the entire page.
Strictly greater than (numerical): >.
Equal to or greater than (numerical): =>.
Strictly less than (numerical): <.
Equal to or less than (numerical): =<.
The number of the page.
The number of the row.
These tests will allow Designer to validate or not to validate a condition.
<translate>
Générer un projet
Une fois la maquette terminée, il ne reste plus qu’à la générer pour l'utiliser dans M-Processing Server.
Pour cela, cliquer sur le bouton Projet du menu Accueil.
A cette étape, veillez à avoir, convenablement, paramétré le serveur dans Préférences.
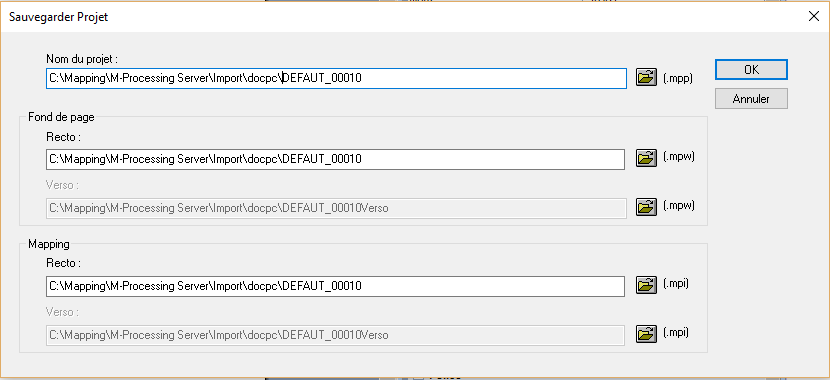
La fenêtre Sauvegarder Projet s’ouvre alors et il faut vérifier que le chemin de génération est correct. Par défaut, le projet est généré dans le répertoire docpc du dossier Import.
- Unix: /apps/mapping/import/docpc/
- Windows: C:\Mapping\M-Processing Server\Import\docpc\
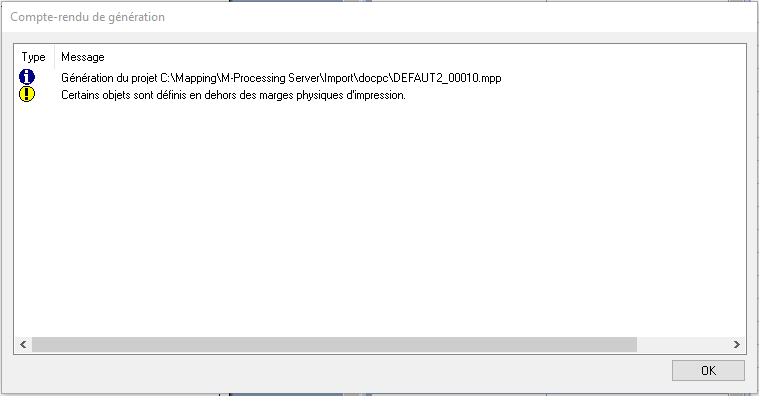
Une fenêtre de post-génération s'affiche une fois le projet généré pour vous signaler le ou les résultats de la génération.
La maquette est désormais prête à être importée dans Onyx Server. </translate>
<translate>
Fonctionnalités avancées
Code à barre
Création d’un code à barre
Pour créer un code à barre dans Designer, il suffit de créer une zone de type Code Barre et de sélectionner le sous-type de code à barre voulu.
Les types de codes à barre
- EAN 8 Ce code à barre sert à tracer des unités logistiques, à identifier des unités de stockage. La version huit caractères sert au colis de petite taille. Les données doivent contenir sept chiffres. Le huitième caractère est un caractère de contrôle qui est calculé par l'ordinateur.
- EAN 13 Ce code à barre sert à tracer des unités logistiques, à identifier des unités de stockage. Dans un EAN 13 les deux premiers caractères sont les identifiants du pays d'origine, les 10 autres sont les données et le dernier est le caractère de contrôle qui est calculé par l'ordinateur. Les données doivent donc contenir 12 chiffres.
Code 39
Ce code à barre sert à coder des données alphanumériques. Il est utilisé dans presque toutes les industries mais pas dans le commerce de détail. Les données peuvent être de longueur variable et peuvent contenir des lettres et des chiffres.
L'information peut être de longueur quelconque et contenir des chiffres, des majuscules et les signes « espace », « plus », « moins », « divise », « point », « pourcentage » et « dollar ».
- Code 128 Ils permettent de coder des données alphanumériques générales et des données ASCII. Ces codes à barre sont utilisés dans de nombreuses industries pour la gestion de stocks. Les données sont de longueur variable. Le code 128 C doit contenir un nombre pair de caractères (sinon un zéro est ajouté en début de code barre) et ne peut contenir que des chiffres. Code 128 B accepte la totalité des caractères ASCII, alors que le code 128 A n'en accepte qu'une certaine partie. L’information à coder peut être de longueur quelconque et propose un choix d'encodage :
- Optimisé : chiffres, majuscules, minuscules, signes ASCII affichables ou non d’ordre inférieur à 128, et tous signes et caractères de fonction prévus par le Code 128 dans les jeux A, B et C, avec optimisation systématique de longueur
- N/optimisé : chiffres, majuscules, minuscules, signes ASCII affichables et caractères de fonction prévus par le Code 128 dans le jeu B, sans optimisation de longueur
- Numérique : chiffres et caractère de fonction prévu par le Code 128 dans le jeu C, avec optimisation systématique de longueur.
- Code 2/5 entrelacé Ce codage de nombres privilégie la densité, en réponse à un cahier des charges spécifiques. La sécurité obtenue par cette symbologie est faible, sauf à employer des moyens optionnels de sécurisation (caractère de contrôle, messages de longueur fixe et contrôlée à la lecture).
- Bien que le nombre de longueur est quelconque, le principe d'entrelacement impose :
- Un nombre pair de chiffres lorsque le caractère optionnel de contrôle n'est pas mis en œuvre.
- Un nombre impair de chiffres lorsque le caractère optionnel de contrôle est mis en œuvre.
- Code 2/5 industriel Cette symbologie ancienne a été très utilisée dans l'industrie, principalement automobile. La sécurité de cette symbologie est faible, sauf mise en œuvre de message de longueur fixe et contrôlée à la lecture. Les données doivent contenir de 1 à 32 chiffres
- Codage d'information numérique privilégiant la facilité de mise en œuvre.
- Évolution ou modification d'applications préexistantes.
- EAN128 Alpha n/optimisé Il s'agit du code GS1-128 Utilisé pour l’identification des unités d’expédition (la palette, éventuellement le carton).
- Codage d'information alphanumérique,
- Longueur variable,
- Auto-contrôlé Continu Bidirectionnel.
- EAN128 numérique Il s'agit du code GS1-128 Utilisé pour l’identification des unités de d’expédition (la palette, éventuellement le carton).
- Codage d'information numérique,
- Longueur variable,
- Auto-contrôlé Continu Bidirectionnel.
- PDF 417 Utilisé dans tous secteurs d'activité. Le code PDF417 est le seul code à barres bidimensionnel pouvant être lu à l'aide d'un lecteur linéaire (1D) car, en tant que symbologie linéaire empilée, il partage les caractéristiques des codes à barres linéaires et bidimensionnels.
- Bidimensionnel,
- Longueur 2000 Alphanumérique,
- Huit niveaux de sécurité.
- Data Matrix Ce code permet d’encoder jusqu’à 2335 caractères. Divers types d’encodage sont disponibles (ASCII, C40, Text et Base 256), le mode par défaut est le mode automatique qui permet d’optimiser l’encodage en permutant d’un mode à l’autre suivant les données. Il existe également un système de détection/correction d’erreur pour réparer toute dégradation.
- Postnet Le code à barres Postnet est utilisé par le service postal des États-Unis. Il est remplacé par l'USPS ou Intelligent Mail barcode.
- Planet Le code à barres Planet est utilisé par le service postal des États-Unis. Il est remplacé par l'USPS ou Intelligent Mail barcode.
- QR Code Il a la particularité de pouvoir encoder un très grand nombre de caractères (7336 en mode numérique). Ce type de code barre est très répandu au Japon. Il existe quatre types d’encodage (alphanumérique, numérique, octets, Kanji) permettant de compresser plus ou moins les données selon leur type. Par défaut, un mode automatique est utilisé afin de choisir l'encodage qui donnera le meilleur taux de compression (basculement de mode en cours de traitement). Des codes de détection/correction d’erreur sont ajoutés aux données, ce qui permet de résister à des dommages sans perte de données. Il existe quatre niveaux de détection/correction d’erreur.
- MaxiCode Le code à barres MaxiCode, développé par UPS – United Parcel Service, est défini par la norme ISO 16023-2000. Contrairement aux autres, il a une taille fixe, ce qui limite le nombre de caractères à encoder. En effet, le nombre de caractères maximum est de 93 caractères alphanumériques ou de 138 caractères numériques. Il existe deux types d’encodage. Le premier encode uniquement une chaîne de caractères contenant des données suivant un encodage classique et une détection / correction d’erreur standard. Le second type encode, en plus de la chaîne de données, trois autres champs (le pays codé sur 3 chiffres suivant la norme ISO 3166, le code postal codé sur 6 caractères et enfin un type de service sur 3 chiffres). Ces trois champs sont encodés en utilisant un mode de correction d’erreur étendu contrairement à la chaîne de données dont le mode de correction est classique.
- Japan Postal Le code à barres Japan Postal est utilisé par le service postal du Japon.
- Codabar (NW7) Au Japon, le Codabar Monarch est aussi appelé NW-7. La composition relativement simple du Codabar Monarch fait qu'il est fréquemment utilisé pour coder des numéros de série pour les applications de banques de transfusion sanguine, services de livraisons à domicile, bibliothèques, etc.
- USPS USPS = United States Postal Service. Le nom officiel est plutôt Intelligent Mail Barcode. Il s'agit du nouveau code à barres postal américain qui doit remplacer le Planet et le Postnet. L’Intelligent Mail Barcode est un code à barres à quatre états composé de 65 barres.
- UPC-A Le code à barres UPC-A est un équivalent américain du code à barres EAN13, dont le premier chiffre serait 0. Il sert principalement à identifier les produits en magasin. Le code à barres UPC-A permet l’encodage de 11 chiffres, un Number System, cinq chiffres pour le Manufacturing Code et cinq chiffres pour le Product Code. Un 12eme chiffre est calculé à partir des onze premiers pour servir de contrôle.
- UPC-E Le code à barres UPC-E est une version courte du code à barres UPC-A, les dix chiffres du code à barres UPC-A (Manufacturing et Product Code) sont réduits à six chiffres en supprimant des zéros superflus. Avec le Number System et le chiffre de contrôle un code à barres UPC-E se compose donc de huit chiffres. MapDraw permet l’encodage de code à barres UPC-A (11 chiffres) en UPC-E, mais aussi de code réduit de 6, 7 ou 8 chiffres.
- MSI Le code à barres MSI est utilisé principalement pour le contrôle des stocks, le marquage des conteneurs de stockage et des étagères dans des environnements d'entrepôt. Un code à barres MSI utilise une ou deux clé de contrôle, calculée par modulo 10 ou modulo 11 et permet d’encoder des valeurs numériques de taille indéfinie. Designer permet l’encodage soit avec une clé de contrôle modulo 10, une clé de contrôle modulo 11, deux clés modulo 10, ou encore une modulo 11 suivie d’une clé modulo 10.
La taille du code à barre
La taille du code à barre peut être définie de deux manières :
- La première consiste à choisir l'option Adapter à la zone dans la vue des propriétés, le code à barre s'adaptera alors du mieux possible à la taille de la zone, selon sa norme.
- Si l'option Adapter à la zone est décochée, la taille du code à barre peut être réglée par la taille de la police de la zone. Cette taille influe sur la largeur et la hauteur du code. La hauteur peut être réduite en réduisant le pourcentage du paramètre Hauteur de la zone.
Cumul de données
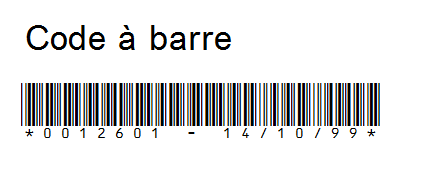
Il est possible de cumuler, dans un code à barre, des données qui se trouvent à différents endroits dans le spool. Pour cela, il faut créer autant de zones mémoires qu’il y a de données à récupérer dans le spool puis il faut cumuler toutes ces zones dans le label de la zone code à barre.
- Dans la partie Map R :
- Dans la partie Propriétés :
- Dans cet exemple, les zones mémoires ont pour valeurs:
- MEM_FACT : 0012601
- MEM_DTFACT : 14/10/99
- Résultat :
Il est aussi possible d’ajouter du texte qui ne se trouve pas dans le spool grâce à l’utilisation des zones Mémoire (détaillées dans le paragraphe 6.4.a.3 Type de zones) : [[MEM1]]TEXT[[MEM2]].
Si vous utilisez des zones de remplacement dans une zone Code à Barre, il faut que la longueur de la zone code à barre soit égale à 0.
Cas particulier : EAN128
L’encodage de l’EAN128 est identique à l’encodage du Code128, c’est pour cela que nous utilisons les mêmes polices. La différence est que l’EAN128 est structuré afin de normaliser les informations qu’il contient. Pour cela, entre chaque information est inséré un AI (Application Identifier) qui permet d’identifier la donnée encodée.
Structure de l’EAN128 : START FNC1 AI DATA (FNC1) AI DATA .... (FNC1) AI DATA CRC END
FNC1 : Caractère séparateur de l’EAN128.
AI : Application Identifier, permet de coder plusieurs informations normalisées dans un même code (date+heure+...).
Le premier FNC1 est ajouté automatiquement par Designer. Il est obligatoire, en effet il permet de différencier un code barre EAN128 d’un code barre CODE128.
Par contre, les FNC1 suivants sont optionnels. En effet, ils sont obligatoires uniquement lorsque la donnée précédente n’est pas de longueur fixe, dans ce cas, ils permettent de séparer chaque donnée.
Si vous souhaitez insérer le caractère FNC1, il vous faut mettre dans votre spool la suite de caractères {FNC1}. Ces caractères seront remplacé automatiquement en caractère FCN1 par MAPPING.
Ex: SPOOL ----> MAPPING
AI DATA ----> START FNC1 AI DATA CRC END
AI DATA {FNC1} AI DATA ----> START FNC1 AI DATA FNC1 AI DATA CRC END
Si vous ne pouvez pas modifier votre spool pour ajouter les caractères « {FNC1} » ou si vous souhaitez cumuler plusieurs données qui se trouvent à différents endroits du spool (voir paragraphe précédent : 8.1.b. Cumul de données), vous pouvez utiliser les zones mémoires.
Cas particulier : code 128
Il y a trois modes d’encodage des codes à barre 128 :
- mode A (alphanumérique),
- mode B (alphanumérique). Le code 128 Alphanumérique encode en mode B,
- mode C (numérique). Le code 128 Numérique encode en mode C.
Le code 128 Alphanumérique Optimisé bascule du mode B au mode C en automatique afin d’optimiser la taille du code à barre.
Par contre, il est possible que vous ayez à respecter un formatage particulier de votre code à barre, c'est-à-dire respecter un certain nombre de caractères en mode A, B ou C.
Par exemple, le code à barre qui correspond à l’identifiant de suivi des courriers de « La Poste » contient 13 caractères. Les trois premiers doivent être encodés en mode B et les dix derniers en mode C.
Pour réaliser ce code à barre avec Designer, vous devez créer une zone de type « Code 128 N/Optimisé » puis saisir un masque de formatage dans les options Avancées de cette zone.
Exemple :
Soit la donnée suivante : 1J45034500751
Vous souhaitez encoder :
- les trois premiers caractères (1J4) en mode B
- les dix derniers caractères (5034500751) en mode C
Votre masque de formatage doit donc être BBBCCCCC.
Vous pouvez remarquer que bien qu’il y ait dix chiffres à encoder en mode C, on ne précise que cinq ‘C’ dans le masque de formatage. Cela est dû au fait qu’un caractère en mode C encode deux chiffres.
Cas particulier : Code Barre 2D
Aujourd’hui, MAPPING gère quatre types de codes à barre 2D : PDF417, DATA MATRIX, QR CODE et MAXICODE.
Si l'option « Adapter à la zone » n'est pas cochée, c’est le paramètre « Largeur de code barre » qui va modifier la taille du code à barre. Dans ce cas il faut savoir que la taille des codes à barre peut varier en hauteur et largeur suivant le contenu à encoder.
L’avantage des codes à barre 2D est de pouvoir encoder un nombre important d’informations. Si les données que vous devez encoder se trouvent à différents endroits du spool, reportez-vous au paragraphe 8.1.b. Cumul de données afin de pouvoir les cumuler dans un code à barre unique.
QR code
Le code à barre QR CODE a été développé suivant la norme internationale ISO/IEC 18004. Il a la particularité de pouvoir encoder un très grand nombre de caractères (7336 en mode numérique).
Ce type de code barre est très rependu au Japon. Il est utilisé dans l’industrie mais également par le grand public depuis que les téléphones portables sont capables de le décoder.
Il existe quatre types d’encodage (alphanumérique, numérique, octets, Kanji) permettant de compresser plus ou moins les données selon leur type. Par défaut, le mode automatique est utilisé afin de choisir l’encodage qui donnera le meilleur taux de compression (basculement de mode en cours de traitement). Par exemple, supposons que le début de la chaine contient des données de type alphanumérique. Dès que le programme détecte une chaine d’au moins 13 caractères numériques, il change de mode d’encodage.
Des codes de détection/correction d’erreur sont ajoutés aux données. Ces codes permettent de résister à des dommages sans perte de donnée. Il existe quatre niveaux de détection/correction d’erreur. Nous utilisons par défaut le niveau trois dont les codes utilisent approximativement 25% du code à barre final.
Options avancées disponibles :
- Largeur du code barre : Valeur comprise entre 1 et 15 définissants la taille du code barre.
- Error Level : (7%, 15%, 25% et 30%).
- FCN1 :
- ECI protocol not implemented.
- ECI protocol not implemented, FNC1 implied in first position.
- ECI protocol not implemented, FNC1 implied in second position Dans ce dernier cas, un caractère de séparation (application identifier) doit être précisé.
- Application Identifier : Caractère de séparation, utilisé uniquement avec le FCN1 implicite en deuxième position.
- Type d’encodage :
- AUTO : Encodage automatique des données avec changement de mode en fonction des données.
- ALPHA : Encodage Alphanumérique.
- NUMERIC : Encodage Numérique.
- BYTE : Encodage en octet.
DATAMATRIX
Le code à barres Datamatrix est défini par la norme internationale ISO/IEC 16022 (ECC200). Ce code permet d’encoder jusqu’à 2335 caractères.
Divers types d’encodage sont disponibles (ASCII, C40, Text et Base 256) et le mode par défaut est le mode automatique qui permet d’optimiser l’encodage en permutant d’un mode à l’autre suivant les données.
Il existe également un système de détection/correction d’erreur pour réparer toute dégradation.
Options avancées :
- Largeur du code barre : Valeur comprise entre 1 et 15 définissant la taille du code barre.
- Type d’encodage :
- AUTO : Encodage automatique des données avec changement de mode en fonction des données.
- ASCII : L’encodage ASCII est un plan tacite pour encoder les données ASCII.
- C40 : L’encodage C40 transforme 3 caractères alphanumériques en deux codewords.
- TEXT : L’encodage Text est utilisé pour encoder les caractères minuscules.
PDF 417
Le PDF 417 est défini par la norme internationale ISO/IEC 15438. Ce type de code à barre permet d’encoder jusqu'à 2700 caractères numériques.
Il existe trois types d’encodage de données (alphanumérique, numérique et octets). Le mode automatique permet de choisir le meilleur taux de compression et de changer de mode en cours d’encodage.
Il existe également un mode de détection/correction d’erreur sur huit niveaux. En mode automatique, le niveau sera choisi en fonction du nombre de caractères à encoder.
Options avancées :
- Largeur du code barre : Valeur comprise entre 1 et 15, définissant la taille du code barre.
- Error Level :
- AUTO : choix automatique.
- 0 - 8
- Mode compact : Activation du mode compact ou non.
- Ratio : Permet de déterminer le ratio hauteur/largeur du code barre.
- Colonnes fixes : permet de définir le nombre de colonnes.
- Lignes fixes : permet de définir le nombre de lignes.
La sélection d’un ratio empêche de définir le nombre de lignes et de colonnes.
UPS MAXICODE
Ce type de code à barre, développé par UPS – United Parcel Service, est décrit dans la norme ISO 16023-2000. Contrairement aux autres, il a une taille fixe ce qui limite le nombre de caractères à encoder. En effet, le nombre de caractères maximum est de 93 caractères alphanumériques ou de 138 caractères numériques.
Il existe deux types d’encodage :
- Le premier encode uniquement une chaine de caractères contenant des données suivant un encodage classique et une détection / correction d’erreur standard.
- Le second type encode, en plus de la chaine de données, trois autres champs stockés dans trois espaces mémoire de MapDraw. Ces champs sont : le pays codé sur 3 chiffres suivant la norme ISO 3166 (appelé map_countr), le code postal codé sur 6 caractères (map_zipcod) et enfin un type de service sur 3 chiffres (map_servic). Ces trois champs sont encodés en utilisant un mode de correction d’erreur étendu contrairement à la chaine de données dont le mode de correction est classique.
Options avancées disponibles :
- Largeur du code barre : Valeur comprise entre 1 et 15, définissant la taille du code barre.
Automatisation
L’automatisation de Designer permet de créer des fichiers images correspondant à la preview d’un projet ainsi que de générer un projet ou une association de projets. Le tout en ligne de commande, en mode caché ou non.
Le principe est de construire la commande grâce à un .BAT ou à une remote commande par exemple.
- -InFile : fichier .PAG ou .XML à maquetter.
- -OutFile : Fichier image de sortie.
- -ProjectFile : Projet à ouvrir (.MPP).
- -ProjectAsso : Association de projet à générer (.MPA).
- -MPIFile : Fichier .MPI à ouvrir (onglet MAP).
- -MPWFile : Fichier .MPW à ouvrir (onglet DRAW).
- -Hide : Pour lancer Designer en mode caché.
- -Color : Utilisation de couleur ou non pour la création de l’image.
- -Rotation : angle de rotation de l’image (défaut : 0).
- -Resolution : Résolution de l’image (défaut : 300).
- -Specimen : Ajout d’un texte au-dessus de l’image (texte à préciser en argument).
- -Mode : Choix du mode SPOOL ou XML (défaut SPOOL).
- -Generate : Pour lancer la génération du projet indiqué en argument.
- -FtpUse : 0 = n’utilise pas FTP ; 1 = utilise FTP.
- -FtpFolder : répertoire FTP.
- -FtpLogin : Login FTP.
- -FtpPassword : Mot de passe FTP.
- -FtpIPAddress : Adresse IP du serveur.
- -ShareFolder : Répertoire de partage.
- -ServerName : Nom du serveur (descriptif).
- -Rename : change le FORMAT et SEQUENCE du projet en utilisant son nom. Ex : Facture00010.mpp.
Exemple 1 : Projet généré en PCL, en couleur et 300 dpi
C:\Mapping\M-Designer\M-Designer.exe "-Hide" "-ProjectFile:C:\Mapping\M-Processing_Server \Import\docpc\test.mpp" "-Generate"
Lors de l’utilisation du paramètre « -Generate » (indiquant une génération de projet), le paramètre « -ProjectFile : » ou « -ProjectAsso : » doit être présent pour indiquer le projet à générer.
Si les deux paramètres « -ProjectFile : » et « -ProjectAsso : » sont présents, le projet sera prioritaire pour la génération et l’association de projets sera ignorée.
Exemple 2 : création d’une image BMP couleur, avec rotation de 90°, en 203 dpi et avec l’inscription SPECIMEN par-dessus
C:\Mapping\M-Designer\M-Designer.exe "-InFile:c:\test.xml" "- OutFile:c:\image.bmp" "-ProjectFile:C:\ Mapping\M-Processing_Server \Import\docpc\test.mpp" "-Hide" "-Rotation:90" "- Resolution:203" “-Color” "-Mode:XML" "-Specimen:SPECIMEN"
Pour la création d’une image, les paramètres « -InFile » et « -ProjectFile » sont obligatoires.
Si « -OutFile » est absent, le fichier de sortie prend le nom du fichier d’entrée avec l’extension .BMP.
Le mode par défaut est SPOOL et si le fichier d’entrée est de type XML, vous devez préciser le mode.
Attention : Les guillemets autour de chaque paramètre sont obligatoires.
Vous pouvez également vous référer à la document de M-Designer.exe en ligne de commande : Utilisation de Designer.exe en ligne de commande
Remplacement de caractère
L'objectif est d'expliquer comment remplacer une chaîne de caractères du fichier d'entrée par une autre.
Le principe de fonctionnement est l'utilisation d'un fichier texte comme table de correspondance entre la valeur à remplacer et la nouvelle valeur.
Pour utiliser cette table de correspondance, il faut :
- Définir la zone en mode Type = Texte / Sous-type = Substitution.
- Terminer et générer la maquette
- Ouvrir le fichier ReplaceValue.txt dans un éditeur de texte (type Notepad mais pas Word). La syntaxe du fichier est la suivante :
Valeur à remplacer Tabulation Nouvelle valeur
Ici, le caractère "]" sera remplacé par le caractère ">" et le "Nom" sera remplacé par "Name" (si la valeur à remplacer se trouve dans une zone de Type Texte \ Substitution).
![]() Attention: il est impératifs que le fichier replacevalue.txt ai le même encodage que le projet Onyx Designer. Par exemple, replaceValue.txt doit être unicode si le projet est unicode.
Attention: il est impératifs que le fichier replacevalue.txt ai le même encodage que le projet Onyx Designer. Par exemple, replaceValue.txt doit être unicode si le projet est unicode.
- Sauvegarder le fichier ReplaceValue.txt dans le sous-répertoire lgobitmap de Mapping (par défaut /apps/mapping/import/lgobitmap sur Unix)
Dessiner un tableau
Dessiner un tableau statique
Pour obtenir un tableau parfaitement dessiné et aligné, sans utiliser l'outil Tableau Statique de la vue Fond de page, les étapes à suivre sont :
- tracer d’abord le rectangle du contour du tableau,
- tracer des lignes verticales pour définir les colonnes,
- tracer éventuellement des traits horizontaux pour définir les lignes si besoin (entêtes de colonnes par exemple),
- sélectionner enfin l’ensemble des éléments du tableau puis appuyer sur la touche « a » minuscule du clavier :
Remarque :
Cette aide à la conception est opérationnelle en vue Fond de page et vue Dynamique du projet. En vue Dynamique, il est possible de tracer un tableau à l'intérieur d'un Groupe et de placer, par exemple, une condition d'exécution sur une ligne horizontale pour tracer dynamiquement un trait pour chaque nouvelle ligne de données.
Dessiner un tableau dynamique
Comme annoncé dans les options disponibles pour un groupe (cf. paragraphe 6.4.b.2. Créer un groupe fixe), le mode Tableau permet aux zones du groupe de se comporter comme les cellules d’un tableau. Les zones d’une même ligne se retrouvent donc automatiquement collées.
Remarque :
Redimensionner ou déplacer une zone impacte la taille et le positionnement des zones adjacentes.
Les lignes du groupe (ou conditions) sont visuellement représentées dans la fenêtre de conception. Les zones sont, quant à elles, réparties verticalement en fonction de leur ligne.
Construction d’un graphique
Depuis la partie Map :
- Créer un graphique depuis l’onglet Graphique :
- Et lui donner un nom (ici « GRAPH1 ») :
A partir de là, le graphique complexe peut se construire de deux façons différentes présentées ci-dessous.
Par sélection des zones une à une
- Sélectionner, dans le spool, les zones qui seront utilisées dans le graphique,
- Dans les Propriétés, pour chaque zone définie :
- Les nommer toutes avec le même nom que le graphique (ici ça sera donc « GRAPH1 »)
- Renseigner le Type = « Graphique » :
- Selon l’utilité de la zone dans le graphique, sélectionner le Sous-type correspondant dans la liste proposée :
- Aller dans les Propriétés du graphique et cliquer sur Edition :
- Paramétrer votre graphique en choisissant dans les onglets :
- Type :
- Nom du Graphique : qui sera repris dans le nom des zones,
- Nombre de zones qui va composer le graphique,
- Type de graphique : Camembert, Histogramme ou Ligne :
- Type :
NB : pour le type de graphique = Histogramme, il est possible de définir l’espacement entre les barres à droite et à gauche (en %). Cette option peut permettre, par exemple, de superposer deux graphiques en jouant sur l’espacement des barres de chaque graphique.
- Attributs : permet de choisir le remplissage, le contour, l’épaisseur du contour, le motif, …
- Positionnement : permet de placer les titres (X, Y, du graphique) et la légende, de redimensionner le graphique selon les préférences de l’utilisateur.
NB : La zone d’impression du graphique est celle délimitée par le grand rectangle donc tout ce qui ne sera pas dedans ne sera pas visible à l’impression (ex : la zone « Legend » est à l’extérieur du rectangle dans la première image ci-dessous alors qu’elle est dedans dans la deuxième).
- La Légende se construit en sélectionnant les zones dans le spool qui serviront de légende pour les attributs choisis. Comme pour toute autre donnée, il faut nommer la zone comme le nom du graphique et renseigner les propriétés de la zone avec Type = « Graphique » et Sous-type = « Données de la légende ».
NB : Attention à respecter l’ordre des attributs en sélectionnant les zones qui serviront à la légende car elles suivront le même ordre que celui des attributs.
En créant un groupe
Le principe est le même que celui décrit ci-avant sauf que les données sont regroupées dans un groupe. Cette option est possible si les données du graphique se suivent dans le spool.
- Créer un groupe qui définira les données à prendre en compte pour la construction du graphique et y déposer les zones sélectionnées qui contiennent les données, les titres, légende, ...
- Nommer la/les zone(s) du même nom que le graphique et renseigner ses propriétés avec Type = « Graphique » et le Sous-type selon le rôle de la zone (titre, données, légende…).
La suite de la construction du graphique est la même que celle décrite précédemment.
Opérations arithmétiques dans un groupe
Pour simplifier la gestion de calcul dans un groupe et notamment la gestion de « total » et « sous-total », un outil a été intégré à Designer. Il permet d’effectuer des traitements sur un fichier XML d’entrée à l’aide de scripts. Ces scripts sont exécutés avant l’application de la maquette.
L’ajout de calcul dans un groupe, par l’intermédiaire de cet outil, se fait par la fonction de script « addline ». La fonction addline permet d’ajouter une ligne à un groupe, en lui précisant une séquence de couples « nom du champ/valeur » à ajouter.
De plus, les paramètres de type « chaine de caractère » devront être entourés de doubles guillemets et les noms de champ dans les formules par des simples guillemets.
Syntaxe :
addline(nom du groupe, nom de la ligne, ligne de type saut de page, nom du 1er champ, valeur du 1er champ, pré-calcul du 1er champ, nom du 2ème champ, valeur du 2ème champ, pré-calcul du 2ème champ, etc…) ;
La fonction addline commence par les arguments suivants :
- Nom du groupe : Contient le nom du groupe sur lequel la ligne doit s’ajouter.
- Nom de la ligne : Nom de la ligne à ajouter.
Puis, elle se compose d’une séquence illimitée de couples champ / valeur :
- Nom du champ : Nom du champ que possèdera la ligne.
- Valeur du champ : La valeur du champ possédé par la ligne.
- Pré-calcul: Valeur booléenne. (0 ou 1, yes ou no). Si le champ possède un calcul alors cela permet de définir quand le calcul doit s’effectuer :
- Yes : Le calcul est résolu lors de l’exécution du script, prenant en compte toutes les valeurs du xml.
- No : Le calcul est résolu lors de l’utilisation de la valeur dans une maquette et ne prend donc en compte que les valeurs présentes dans la page en cours.
Par exemple, le script suivant ajoute cette ligne au groupe nommé "groupe" :
addline("groupe","ligne",yes,"champ1","valeur1",no,"champ2","valeur2",no);
<group name="groupe">
…
<line name="ligne" pagebreak=”1”>
<field name="champ1">valeur1</field>
<field name="champ2">valeur2</field>
</line>
</group>
La valeur du champ peut contenir un calcul dont la syntaxe est la suivante :
SUM('''''opération''''') pour calculer une somme sur l’ensemble des lignes du groupes.
AVG('''''opération''''') pour calculer une moyenne sur l’ensemble des lignes du groupes.
Ici, « opération » est un calcul mathématique utilisant les noms des champs présents dans les lignes du groupe. Les noms de champs doivent être entourés par des simples guillemets.
Prenons l’exemple de ce groupe :
<group name="invoice">
<line name="item">
<field name="name">item 1</field>
<field name="price">10</field>
<field name="quantity">2</field>
</line>
<line name="item">
<field name="name">item 2</field>
<field name="price">5</field>
<field name="quantity">3</field>
</line>
<line name="item">
<field name="name">item 3</field>
<field name="price">12</field>
<field name="quantity">4</field>
</line>
<line name="item">
<field name="name">item 4</field>
<field name="price">5.5</field>
<field name="quantity">3</field>
</line>
</group>
Pour ajouter une ligne de total à ce groupe, il faudra utiliser ce script :
addline("invoice", "LigneTotal",no
"total", "total = SUM('price'*'quantity')", yes
"moyenne", "moyenne = AVG('price'*'quantity')", yes
);
Ce script aura pour effet d’ajouter une ligne de total à la fin du groupe :
<group name="invoice">
…
<line name="item">
<field name="name">item 4</field>
<field name="price">5.5</field>
<field name="quantity">3</field>
</line>
<line name="LigneTotal">
<field name="total">total = 99.5</field>
<field name="moyenne">moyenne = 24.875</field>
</line>
</group>
L’utilisation de l’option Pré-calcul à « no » permet de ne pas exécuter les calculs lors de l’ajout de la ligne au groupe mais lors de son exécution par la maquette. L’intérêt de cette option est de pouvoir effectuer des calculs uniquement avec les données écrites sur la page en cours, permettant donc l’écriture de sous-totaux.
Pour ajouter une ligne de sous-total au groupe précédant, il faudra utiliser ce script :
addline("invoice","LineSubtotal",yes, "subtotal","sous-total = SUM('price'*'quantity')",no);
Ce script aura pour effet d’ajouter une ligne de total à la fin du groupe :
<group name="invoice">
…
<line name="item">
<field name="name">item 4</field>
<field name="price">5.5</field>
<field name="quantity">3</field>
</line>
<line name="LineSubtotal" pagebreak=”1”>
<field name="subtotal">sous-total = SUM('price'*'quantity')</field>
</line>
</group>
Gestion de la pagination
La gestion de l’écriture d’information de pagination tels que le nombre de page total, le nombre de lot et le nombre de page dans le lot est possible dans Designer grâce aux deux options suivantes.
Rupture de lot
L’option Rupture de lot se trouve dans les Propriétés de la maquette (présentée dans le paragraphe 4.2. Création d’un projet). Elle permet de faire référence à une zone de type Métadonnée qui sera utilisée pour regrouper les pages du document final en lot.
![]() Dans la liste des objets, cette zone Métadonnée doit être placée en tête afin d'être exécutée avant toute autre zone. Une exception s’applique tout de même si des zones mémoires sont nécessaires à sa construction dynamique.
Dans la liste des objets, cette zone Métadonnée doit être placée en tête afin d'être exécutée avant toute autre zone. Une exception s’applique tout de même si des zones mémoires sont nécessaires à sa construction dynamique.
Lors du traitement de la page :
- Si la zone Métadonnée récupère une nouvelle valeur alors un nouveau lot sera créé. La page en cours appartiendra à ce nouveau lot.
- Si la zone Métadonnée récupère une valeur déjà récupérée précédemment, la page en cours sera déplacée vers le lot correspondant à cette valeur.
- Si aucune valeur n’est récupérée par la zone Métadonnée, la page reste dans le même lot que la page précédente.
C’est le système de multi-document du XPS qui est utilisé pour représenter les lots, le fichier de sortie est donc trié par lot (d’abord les pages du premier lot puis les pages du second, etc…).
Variables de remplacement
Pour permettre l’écriture des informations de pagination, il existe des variables de type « post-traitement », c’est-à-dire qu’elles ne seront remplacées par leur véritable valeur qu’au moment de l’impression.
ATTENTION : l'ordre d'exécution des zones est TRES important pour ne pas qu'il y ait de décalages. En l'occurence, la zone de type Métadonnée doit être exécutée AVANT d'utiliser les fonctionnalités suivantes si celles-ci sont utilisées au sein de zones "bleues". Pour rappel, l'ordre d'exécution des zones est modifiable via l'onglet "Liste des objets"
La syntaxe d’utilisation est la suivante :
[[PST:nom de la variable;valeur par défaut]]
La « valeur par défaut » est obligatoire et permet d’avoir un texte présent dans la page. Ce texte temporaire sera, par la suite, remplacé par sa vraie valeur. Il est important car c’est grâce à ce texte que les calculs de positionnement se feront. Ce texte doit donc posséder un nombre de caractère au moins égal à la valeur maximale attendue par la variable utilisée.
Par exemple :
[[PST:MAP_TOTAL_PAGE;000]]
Affichera "000" dans la page, mais au moment de l’impression cette valeur sera remplacée par :
- " 5" s’il y 5 pages au total.
- " 10" s’il y 10 pages au total.
- "150" s’il y 150 pages au total.
[[PST:MAP_TOTAL_DOC]] = nombre total de lot.
[[PST:MAP_TOTAL_PAGE_IN_DOC]] = nombre de page dans le lot en cours.
D’autre syntaxes existent aussi, accessibles quant à elles pendant le traitement de la page :
[[VAR:MAP_CURRENT_PAGE]] = numéro de la page en cours.
[[VAR:MAP_CURRENT_DOC]] = numéro du lot en cours (la zone Métadonnée gérant la rupture de lot doit être définie avant l’utilisation de cette variable).
[[VAR:MAP_CURRENT_PAGE_IN_DOC]] = numéro de la page en cours dans le lot en cours.
Et de manière générale :
[[VAR:variable d’env]] = récupère le contenu de la variable d’environnement.
Gestion des veuves et orphelines
Une gestion complexe des veuves et orphelines est possible grâce à deux fonctionnalités : Groupe entier et Répéter un groupe XML.
Groupe entier
Lorsqu’on utilise une génération de saut de page de type Limite, une nouvelle option apparait dans les Propriétés du groupe : Groupe entier. Cette option permet d’indiquer que le groupe ne peut pas être coupé et qu’il doit donc s’imprimer intégralement sur une seule page. Si la limite déclenche un saut de page, aucune ligne du groupe ne sera imprimée, le groupe sera entièrement traité sur la page suivante.
Répétition de groupe XML
La répétition de groupe XML part du principe que le groupe apparait plusieurs fois dans le fichier XML d’entrée. Cette fonctionnalité s’active avec le paramètre « Répéter » dans les propriétés du groupe.
Exemple :
Dans l’exemple ci-dessous, le groupe “invoice” apparait trois fois dans le XML. Par défaut, le groupe de la maquette ne pourra récupérer que les informations de la première apparition du groupe dans le XML. Mais si l’option « Répéter » est cochée, l’exécution du groupe se poursuivra sur toutes les apparitions.
<group name="invoice">
<line name="item">
<field name="name">item 1</field>
<field name="price">10</field>
<field name="quantity">2</field>
</line>
<line name="description">
<field name="description">Description item 1</field>
</line>
</group>
<group name="invoice">
<line name="item">
<field name="name">item 2</field>
<field name="price">5</field>
<field name="quantity">3</field>
</line>
<line name="description">
<field name="description">Description item 2</field>
</line>
</group>
<group name="invoice">
<line name="item">
<field name="name">item 3</field>
<field name="price">12</field>
<field name="quantity">4</field>
</line>
<line name="description">
<field name="description">Description item 3</field>
</line>
</group>
L’utilisation conjointe d’une limite générant des sauts de page avec l’option “Groupe entier” et la répétition active permet de gérer un système complexe de veuves et orphelines.
Dans notre exemple, les lignes « item » et les lignes « description » ne pourront pas être séparées par un saut de page.
</translate>
