ONYX - 9.0 - Exploitation
Guide d'utilisation du dashboard EN
Sommaire
Introduction
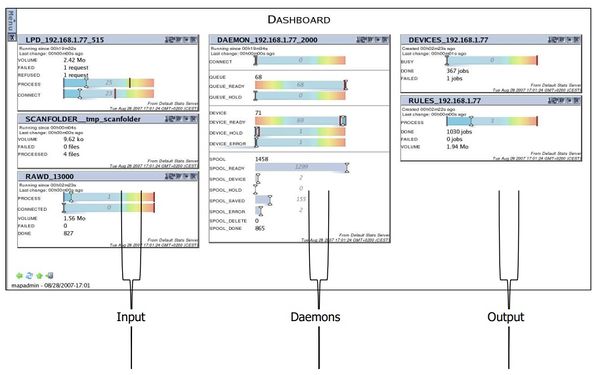
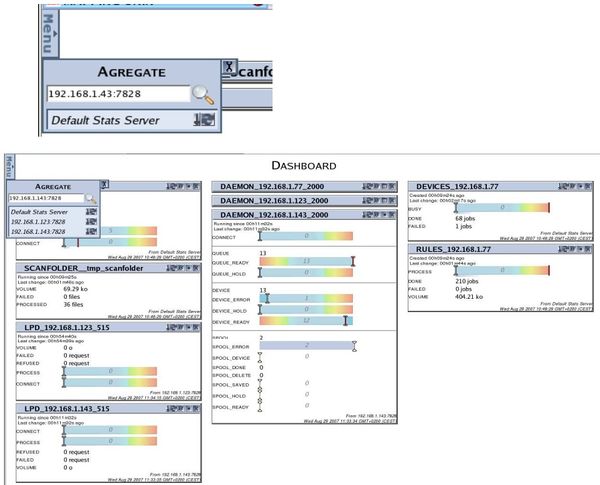
The Dashboard gathers statistics about the Mapping spooler on UNIX and Windows. To open the Dashboard, go back to the start page and click the Dashboard menu picture.
General workflow
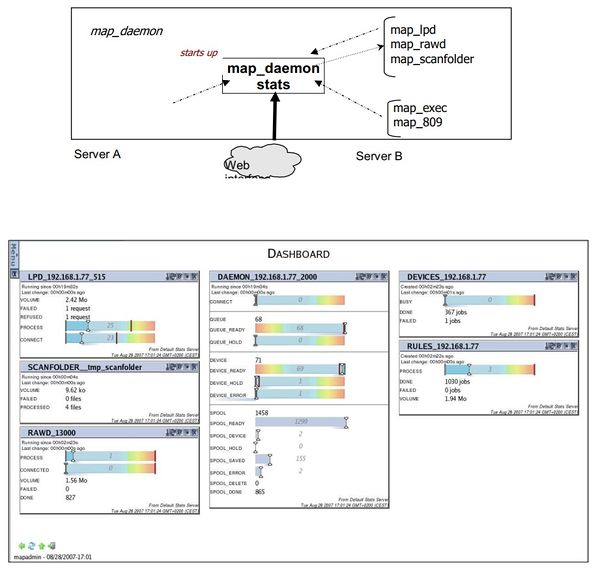
When the spooler’s daemon starts up, a parallel server is also started at the same time to collect information about the spooler. The key processes of the spooler connect to that server to send information in a transparent way. Through a Web interface, the user can interrogate one or more servers and generate statistics on the dashboard to see at a glance how the different spooler processes are working.
Configuration
The spooler configuration file (mapping.conf) must include the following block.
#MAP_STATD CONFIG
[MAPSTATD_ID] map_statd.ID
[MAPSTATD_SERVER_IP] 192.168.1.XX
[MAPSTATD_PORT] 7828
[MAPSTATD_SERVERSTDIN] /dev/null
[MAPSTATD_SERVERSTDOUT] /tmp/map_statd.out
[MAPSTATD_SERVERSTDERR] /tmp/map_statd.err
[PATH_MAP_STATD] map_statd
[MAPSTATD_CONFIGFILE] /etc/mapping/statDaemon.cfg
The file specified in [MAPSTATD_CONFIGFILE] is used to configure some of the settings of the variables that will be checked.
Example:
<daemon*>
  <spool_error>
    <limit>33</limit>
  </spool_error>
  <spool_*>
    <limit>1000</limit>
  </spool_*>
</daemon*>
This will set the maximum number of spool files displayed in error to 33 and the other types of spool files to 1000 for all the daemons watched over by this server.
Note :
This file is optional
Level gauges with level indicators
The elements monitored that are subject to variations are displayed using level gauges so the user can easily see if the system limits are reached, if the variation amplitude is high and if they tend to vary quickly
Detailed statistics
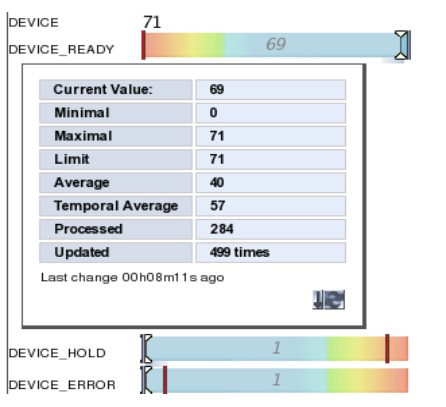
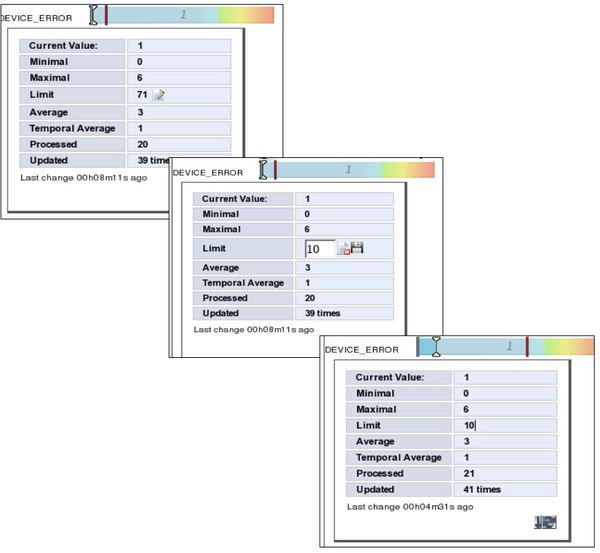
Click any of the lines to show a table of detailed statistics.
Note that all the data will not be relevant in all cases.
• Current Value: the value currently achieved
• Minimal: the minimum value reached
• Maximal: the maximum value reached
• Limit: theoretical maximum value that can be reached (red zone)
• Average: arithmetical average (sum of values divided by the number of elements)
• Temporal average: Average value weighted by time (the longer a specific value is reached,the more weight it has in the average)
• Processed: the number of elements processed (e.g. for SPOOL_ERROR, Current Value is thenumber of spool files in error at a given instant, whereas Processed shows the total number ofspool files in error).
• Updated: the number of times this line has been updated.
Monitoring how the processes stop
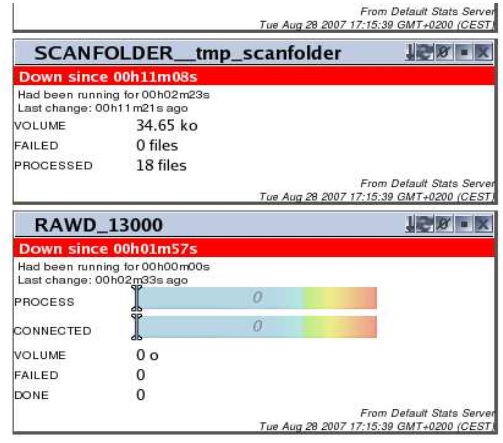
If processes of 'daemon' type that send information to the statistics server should stop, a messadisplay showing when they stopped and how long they had been running before they stopped
Server aggregate
From the Dashboard interface, different servers can be watched at a time. To do so, click the icon under the contextual menu to open the management window. Enter the address of the server under the form IPaddress:port (the default port being 7828, and STAT on a telephone keypad) and confirm. If the server is available, its data will be added and the name of the server will be added to the list. If,on the other hand, the server is not available, an error message will display.
Toolbar
Each stats block comes with a toolbar to do different things.
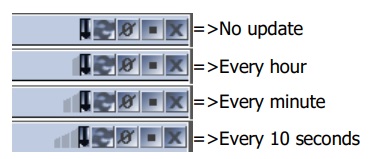
Automatic Update
This option is available for servers, stats blocks and individual stats. It will automatically update the status at regular intervals, from every 10 seconds to every hour (intervals subject to change!). Click once to switch to the next interval as shown in the following screen capture.
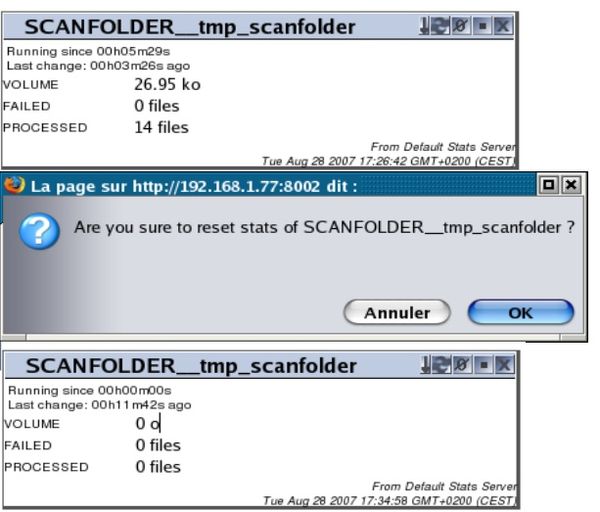
Reset
Use this to reset the statistics of 'counter' type (number of spool files, volume processed ...)
Setting limits
To edit the level gauge limits, click the Modify icon that appears when gliding over the Limit field. Note that the change is volatile i.e. it will be reset to the initial value the next time the system starts up. Also, the change will be made visible to all users.
