ONYX - 9.0 - Usage
ONYX Designer Technical guide
Sommaire
- 1 Introduction
- 2 Configuring Designer
- 2.1 General
- 2.1.1 Automatic save
- 2.1.2 Lock projects upon opening
- 2.1.3 Create .bak files
- 2.1.4 Select object before moving
- 2.1.5 Enable script editor
- 2.1.6 Show all component errors
- 2.1.7 Straight lines
- 2.1.8 Temporary folder
- 2.1.9 List of characters to be displayed in double width
- 2.1.10 Default style
- 2.1.11 Language
- 2.2 Configuring the servers
- 2.3 Font
- 2.4 Calculation options
- 2.1 General
- 3 Interface of the application
- 4 Creating a project
- 5 Overlay (Draw Tab)
- 6 Dynamic Part (Map Tab)
- 7 Generating a project
- 8 Advanced features
Introduction
Objectives
In the ONYX suite, ONYX Designer is the module dedicated to creating document templates. This page is a reference guide for the configuration and usage of Designer in the ONYX Suite. This introduces you to all the features of the application.
Prior training is required to use Designer. This page is not intended to replace the dedicated training.
Presentation of Designer
Designer is the design and graphic mapping module for documents. It is used to transform simple files with static data into high-quality graphic documents.
In the ONYX Suite, Designer relies on the use of XPS Mapping design language (MXPS).
No software keys are required to use Designer on a Windows workstation.
The software runs on Windows workstations and features a dual sided user interface. The first part is a drawing view used to create overlays, which can be compared to pre-printed paper in the printing industry. The second part is a dynamic view used to retrieve data, manage it and display it.
Whether it comes from a file, is extracted from a database or an ERP, or is formatted beforehand via the Connect software, data is displayed "flat" (paginated text format) or in XML (compatible with Designer - see 6.3 Mode XML : syntax and specifications).
The template (document template) is designed on the user workstation that is hosting the application with a "Preview" mode to validate changes as soon as they are made. During the design process, the document template is called a Designer Project.
The template is then generated and imported on the ONYX Server (Linux or Windows) to be used in production. This is then called a Designer Format.
ONYX:9.0:Utilisation:paramétrage de ONYX Designer
Configuring Designer
After Designer was installed, the first step is to configure the Preferences (see 1) of the application. They are accessed from the File menu (see 2). The preferences are local to the current user and are stored in the Windows registry of the workstation under HKEY_CURRENT_USER/Software/Mapping.

General

The first tab of the Preferences window displays the general options of the application.
Automatic save
This option programs an automatic save of the projects being designed (opened in the application). The projects are saved at regular intervals defined in minutes in the corresponding input field.
Lock projects upon opening
As will be referred to later in this guide, several users can work with Designer at the same time using a common folder for projects. In this case activating this feature is recommended as it will prevent concurrent access to the same project.
As soon as a user opens a project, writing access is denied to other users. Other users can then only access the project in read-only mode.
Create .bak files
This option allows you to keep N-1 versions of the project when saving it. The corresponding files then have the ".bak" suffix added as their extension.
Select object before moving
As will be referred to later in this guide, All objects positioned in the document template can be edited and moved around. This option forces the user to select an object before he can move it. This prevents objects from being moved accidentally as you select them.
Enable script editor
This option allows you to create, edit, or delete scripts. (see Script editing link)
Show all component errors
This option affects the number of error windows appearing when opening a project with components that are unavailable in the project folder.
- Activated by default, one window is displayed per missing component, asking for the user to provide said component.
- Deactivated, component errors are gathered and displayed in the same window.
Straight lines
This option forces the application to only draw horizontal or vertical lines (most currently used) by disabling oblique lines.
Temporary folder
This option defines the path of the temporary folder. By default, this is the folder for the installation of the application but this value can be changed if needed.
List of characters to be displayed in double width
This input field allows you to add hexadecimal values (or ranges of values) of specific characters to consider and display in double width.
This option is useful to display datastreams in the Spooled file view and preview the document template in real time. A similar feature can be found on Onyx Server in the configuration variable MAPCPYSPLF_DBCSPITCH_LIST.
Default style
This list is used to select or not select a style template to define a list of colours, line type, fonts, etc. for your project.
Language
This option is used to choose the display language of the interfaces of the application. The default language of Designer is the same as that of your operating system. The available languages are English, French and Japanese.
Changing the language of Designer affects the other tools in the Suite, including Connect, and the application has to be restarted for any change to be registered.
Configuring the servers
The Servers tab of the Preferences view is used to configure the paths the application must have access to:
- The shared folder of the Designer projects sources.
- The import folders for formats in Onyx Server.
The shared sources folder contains all the projects developed by all the Designer users.
Once developed, Designer projects mut be generated on the production server in the import folder.
Here are the default paths of the import folder of the Onyx Server according to the type of platform used:
- Unix: /apps/mapping/import/
- Windows: C:\Mapping\M-Processing Server\Import\
To generate the project, a connection must be established between the development workstations and the production server. Two types of configurations are possible.

Required settings:
- Name of the server: Name given to the configuration.
- Shared folder: Shared folder for the sources.
- Access path: destination path of the generation.
- Import folder: Onyx Server import folder, only used for option "Send mapping".
The server access folder can be:
- A UNC path Examples:
\\test_server\ProgramData\M-Processing Server\Import\ (under Windows)\\test_server \home\mapping\ (under iSeries)
- A network drive with the address of the import folderExample: either a network drive "M:" with the address of the "...\M-Processing Server" folder of the production server. The access folder thus contains "M:\Import\".
In the case of a UNIX production server, a "Samba" type software application must be installed for this connection mode so that the development workstation can communicate with the production server. Connections using the FTP mode are preferable.
Access to the server using an FTP connection
In this case, an FTP (or SFTP) connection must be established between the development workstation and the production server.

Required settings:
- Name of the server: Name given to the configuration.
- FTP/FTP Passive/Secure FTP: Choice of connection mode: FTP, FTP Passive, Secure FTP.
- IP address or Name: IP address of the production server.
- Login: User name for the FTP access.
- Password: Related password.
- Sharing folder: Shared folder for sources.
- Access path: Access path to the Onyx Server import folder.
- Import folder: Onyx Server import folder, only used for the "Send mapping" option.
Font
The Generation of XPS fonts by code page field is used to pre-load XPS fonts by defining one or several code-pages to optimise processing time during the process. The separation character used is code-pages is ";".
Note: When a project is imported, if it is written in a non-registered font, a warning message is displayed in red in the "Properties" of the zone affected, specifying that the font is missing.


Calculation options
The two options in the Calculation tab define thousands and decimal delimiters. This information is used to retrieve integer or real values in the application (by memory zones), calculations and results display in the preview.
Neither of them affect the generation of projects.
Similar options exist for execution in M-Processing Server: MAPCPYSPLF_THOUSAND and MAPCPYSPLF_DECIMAL.
These settings are used to run all templates, however, they can be set differently before running any Mapping commands, to use other delimiters and fit regional standards.
Interface of the application
General presentation
When using Designer for the first time, only the overlay designing view is displayed. This simple display mode allows you to only activate the windows you need.
Window activation is explained in 3.2.a File menu.

The following image shows an overview of the Designer user interface. In this example, the Spooled File View, Properties, Conditions and Object Tree windows are activated.
It is divided in several parts:
- 1: File Menu
- 2: Tabs in the Ribbon
- 3: Groups of tools associated with each tab of the Ribbon
- 4: Status bar with the tools used to position and size objects
- 5: Navigation between the static and the variable parts of a project + display zoom tools
The Designing Space where templates are designed is found between the menus and tools displayed at the top of the window and the status bar located at the bottom.
This design space can also be made up of several views, in addition to the central Designing view:
- 6: Properties View: of the format, of an object selected in the template
- 7: Spooled file View: included in the same display space as the Properties, multiple tabs are now available.
- 8: Object Tree View list of all the objects in the template (static and variable parts)
- 9: Conditions View: of the format, of a selected object.
The display positions of each view can be configured according to the user preferences and habits. To do so, hold the button of your mouse down when clicking on the title of the View, then drag the mouse to the required display area or on an already positioned view, a display space with several views is now shown.

Menus and associated toolbars
This part introduces you to the different menus and options available within them, in the Designer interface. Each notion will be further detailed in the following parts.
File Menu

New:
- Project: creates a new project with default properties (DEFAULT format, sequence 00010, in A4, simplex).
- Component: creates a new component with default properties (A4, simplex).
- Variable element: creates a new variable element with default properties (A4 simplex).
- Document: creates a new Overlay document (.mpw) or Dynamic document (.mpi) according to the selected view (Draw F or Map F). This overwrites the current document.
Open:
- Project: opens an existing project by browsing file paths. The folder selected by default depends on the Server preferences of the application.
- Component: opens an existing component.
- Variable Element: opens an existing variable element.
- Document: opens an existing Overlay (.mpw) or a Dynamic document (.mpi), according to the selected view (Draw F or Map F). This overwrites the current document.
- Spooled File: used to select a spooled file to load in the application as a designing data template.
Save:
- Project: saves the curent project. Source files of the project will be saved, N-1 versions may also be saved according to user preferences.
- Document: saves the current Overlay (.mpw) or Dynamic document (.mpi), according to the view displayed (Draw F or Map F).
Save as:
- Project: saves the current project under an other name. Source files of the project will be saved under the new names given by the user.
- Document: saves the current document (.mpw or .mpi) under an other name.
Project association:
- Links several projects to make their generation easier. A project association creates a settings file on the disk, with a *.mpa extension, in which the projects concerned and the generation options are listed.
Multiple generation:
- Selects multiple Designer projects to generate them all at once.
Import:
- Designer file: imports another existing Designer overlay such as a component, or the static part of another project, in the static part of the current project.
- XML Designer: imports an entire Designer project in the application, after it was exported to XML. This imports the XML file as a new project, retrieving all its properties and designs.
- Resources: imports an external resource as overlay of a new project, in the application. Resources can either be XPS documents or AFPDS overlays.
Export:
- Printer (PCL5): prints the overlay of the current project on a printer registered on the workstation.
- Project: selects one or several projects to export in an archive (.zip) with the potential associated spooled files.
- XML Designer: exports the entirety of the current project in an XML description file. All properties and designs of the project are found in the resulting file which will then be imported in an other instance of the application, on an other workstation for instance.
Close:
- Closes the current project or document and detects unsaved changes.
Preferences:
- See 2.1 General.
Home Menu
The Home menu gives access to the general options of the project or document being created:

Clipboard:
- Cut/ copy/ paste one or several elements selected in the project (standard keyboard shortcuts Ctrl+X, Ctrl+C and Ctrl+V are also available)
- Copy the formatting of an element onto others (texts or shapes)
- Duplicate a selected element and set the required number of horizontal and vertical occurrences (this is useful when creating sheets of labels for instance).
System fonts:
- Text standard formatting: choose the TTF system fonts available on the workstation (Windows), the size, colour, bold/ underlined/ italic, justified or aligned.
Generate:
- Generate the project being created. This option is only available for projects being created (opened in the application).
- Generate an existing project association.
- Export overlay (see the File Menu part).
- Access the script utility in the Designer application.
Preview:
- Preview project currently being created.
- Select and load a spooled file in the application (this is useful when designing a document and previewing it).
- Multiple preview for multi sequence projects.
- Save an image of the preview.
- Load an XPS file as a layer (not included in the generation but displayed in the design as a pre-printed form).
- Unlink the source file (spooled file) to the template and close it.
- Carry out processings on XML input file using scripts.
Edit Menu
The Edit menu gives access to designing options of the current project or document:

In addition to the Clipboard and Font system sections, the following tools are also available in this menu:
Sort:
- Applied to one or several selected elements, sorting can bring them to the front or to back, manage alignments and rotations. These options can also be accessed by right clicking on the selected elements and further detail will be given in the following parts of this documentation.
Position according to grid:
- To help with designing, a grid can be displayed to make positioning elements easier for the user. The two options of this section help to adjust the spacing of the grid (size of the grid and thus the precision of element positioning) and snap objects to the grid while they are moved.
Display Menu
The Display menu gives access to display options of the different views of the application:

Show/Hide:
Given that none of these options are activated when opening the software for the first time, the functions which are most suitable for the basic use of Designer will be marked with the term (recommended).
- Grid: displays the grid in the designing view.
- Top/Left Ruler: displays the top and left hand rulers of the designing view. It is possible to place guides in these rulers in order to align objects more easily. A Left click on the ruler places and collapses a rule-guide. A Right click on an existing rule-guide deletes it.
- Spooled file view: displays the loading view of the example spooled file (or XML file) (recommended).
- Properties : displays the properties view of the project and elements (recommended).
- Conditions: displays the conditions view (recommended whenever the design work deals with a dynamic part).
- Object Tree: displays the list of all the elements positioned in the document template, some features related to the elements can also be accessed.
- Tab bar: displays the tab navigation bar for the different projects opened in the application.
Characters list:
- Lists all the characters supported by the application according to a code page and font. This can be useful to insert special characters, which cannot be directly typed in, in a document.
Refresh:
- Refreshes the screen.
Windows:
This helps you manage the many windows of your projects opened in the application. It allows you to activate, save or close some of them or all of them all at once.
Shape Menu
This menu features all the drawing and composition tools for your document template. This menu is arranged differently depending on the part of the project concerned, the overlay part (static) or the dynamic part (variable).
Shape Menu of the Overlay (or Static)

In addition to the Clipboard and Font system sections, the following tools are also available in this menu:
Insert:
- Add and position a zone which contains static text. This text can then be formatted using the associated formatting options.
- Add and position a static image (such as a company logo).
- Add, parameter and position a static table by defining the number of rows, columns, the outline and their formatting, as well as the title of each row / column, …
Shapes:
- Standard drawing palette to add lines, curves, squares, rectangles, rounded rectangles, circles, ellipses, as well as some preset shapes.
Styles:
- Formatting options related to each of the previous elements: style and colour of the outline, filling style and colour, line thickness.
Generate:
- This option is specific to components and is used to generate them.
Shape Menu of the Dynamic view

In addition to the Clipboard and Font system sections, the following tools are also available in this menu:
Data:
These tools are used to process source file data (spooled file). There are two types of tools:
Group:
- Adds, parameters and positions groups of data: fixed and variable groups.
- Also adds anchors used to position variable groups.
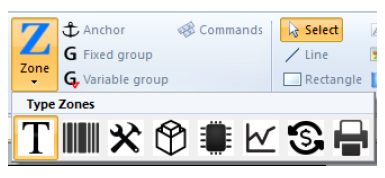
Zone:
- Adds, parameters and positions data recovery zones.
Insert:
- Inserts other dynamic elements, in addition to the data from the spooled file: straight lines, rectangles, text zones input using the keyboard, dynamic images, graphs...
- Adds components and/or variable elements which were designed elsewhere in the project.
"Quick access" toolbar
The title bar of the application features a shortcut bar, or toolbar, called "Quick access:

The tools and features accessible in this zone are completely configurable according to user habits.
To add a feature in the Quick access zone, you need to find the feature using the menus and then, right click and select "Add to the Quick access toolbar" as shown below:

The new feature is then displayed in the title bar:

To delete a feature from the Quick access zone, right-click on it and select Delete from the Quick Access toolbar.
The drop down menu on the right of this zone allows you to customize the features accessible as well as how they are arranged, using the Customize the Quick access toolbar section (display order, add separators):

Creating a project
Project
A Designer project is made up of an overlay, which is the static part of the template, and a data file, which is the variable or dynamic part. A project is identified by a specific format name and sequence number which make it unique within the production server..
On a PC Drive or Network share, a project is made up of three files (or five in the case of a double-sided project):
- A .mpw file with the overlay in simplex (another one for the duplex if necessary)
- A .mpi file with the data formatting in simplex (another one for the duplex if necessary)
- A .mpp file identifies the project and associates it with the other .mpw and .mpi files.
The project term is only used as the template is designed in Designer. Once it is generated on the server, we refer to it as a format and a sequence number.
Creating a project

To create a new project, go to the File menu > New > Project.
The designing view then displays the project as a blank page with default parameters (portrait, A4, simplex).
In the Display tab, we recommend you to check the Properties box in the Show/Hide tab, a window on the right part of the screen appears displaying all the properties to define.

First, you must specify both of these parameters:
- Name of the format = ID of the format with ten characters maximum.
- Sequence = numerical ID of the sequence with five characters maximum.
Formats and Sequences will be explained in further details below.
Other properties can be configured in this panel:

- Description= user information (limited to 25 characters maximum).
- Comment = additional information.
- Destination = generation path of the project (also defined in Preferences).
- Mode = type of data to format: SPLF (text) or XML.
- Code Page = to open a non-Unicode spooled file with an XPS template specifying the file code page in the project properties. This option can only be accessed in SPLF mode.
- Style = selection of the style sheet (also defined in Preferences). This option is explained in further details below.
- Document and Page = allows you to add data in printer language in the output datastream for the following languages: PCL5, APFDS, PDF, ZPL, DPL, TEC, IGP, IPL and EPL. A zone can include data from different languages. When the XPS file is converted to the output language, the data corresponding to the output language is used. Data is specified at the beginning and end of the document.
- Orientation = portrait or landscape fr the simplex and potentially the duplex side.
- Page size (ISO standard formats or customised format) and margins.
- Selection of a simplex or double-sided project (flip the page on the long or the short edge).
- Page break = default setting of the application as it processes data one page at a time and adds a page break once the data of a page has been completely processed. If the break is deactivated, the data of the following page will be placed after that of the page processed.
- Batch breaking = defines a Metadata type zone which will be used to group the pages of the final document together (see 8.8.a. Pagination management by batch breaking).
- Position = if the page break is disabled, this option allows you to specify the position of data on the following page, i.e. to the right of the current page (horizontal shift) or below (vertical shift).
The SO/SI property is used under Windows and Unix to reproduce a native function under iSeries, i.e the EBCDIC spooled file management containing both SBCS and DBCS characters (in particular Asian and Japanese spooled files). This property notifies the application of the detection mode and rendering of the Shift Out and Shift In information (non-printable 0x0F and 0x0E hexadecimal characters) framing the DBCS texts to comply with the spacing between the characters regardless of their width.
In detail, the Style option both limits the number of fonts which can be used in a template and renames these fonts using an alias. For instance, this simplifies the use of resident fonts in a template by renaming the TTF fonts installed on the workstation with the name of the resident fonts of the target printer.
The generated XPS file embeds the new name of the fonts as defined in the style, these names can therefore be used to define alternative fonts in the conversion profile.
Example of a style to print on a Datamax printer:
<?xml version="1.0" encoding="windows-1252" ?>
<style>
<fonts>
<font name="Arial" alias="Datamax 0"/>
<font name="Arial" alias="Datamax 1"/>
<font name="Arial" alias="Datamax 2"/>
<font name="Arial" alias="Datamax 3"/>
<font name="Arial" alias="Datamax 4"/>
<font name="Arial" alias="Datamax 5"/>
<font name="Arial" alias="Datamax 6"/>
<font name="Arial" alias="Datamax 7 (OCR-A)"/>
<font name="Arial" alias="Datamax 8 (OCR-B)"/>
<font name="Arial" alias="Datamax 9 (Arial)"/>
</fonts>
</style>


Designer comes with the following styles by default: Datamax, Eltron, IGP, Intermec, TEC, and Zebra so that older non-Unicode templates can be re-used.
The selection of these styles is automatic when opening an older template.
The project is now ready to be developed.
Format/Sequence
A Format, viewed in Onyx Server, is the equivalent of a Designer project but once it was generated and imported on the production server. The same format can be composed of several sequences.
Every Sequence is conditioned to run on different pages of a data file (spooled file or XML file).
Here is an example to better understand the benefit of having several sequences for one project:
On an invoice with 3 pages:
- The first page includes the recipient's address, the sender's address as well as the start of the invoice table (Page type 1)
- The last page includes the total of the invoice (Page type 2)
- All the other pages contain the body of the invoice (Page type 3)
Processing the spooled file with the same format is difficult since formatting can differ depending on the page type. Three formats will then be created, one for each page type.
These three formats will have the same name because the three together make THE document "invoice" template, however they will have different sequence numbers:
- Sequence 00010 runs on page type 1.
- Sequence 00020 runs on page type 2.
- Sequence 00030 runs on page type 3.
When running the invoice format on a data file, a MERGE of these sequences is carried out to process the spooled file entirely.
Overlay (Draw Tab)
Definition
An Overlay is made up of all static and dynamic elements of a Designer project. It can be compared to pre-printed pages in the printing industry.
The Draw F part is the one used to design overlays, you can access it by clicking on the corresponding tab in the status bar. Selecting this tab gives you access to the "Overlay" toolbar in the "Shape" menu.
If you are working on a double sided project, use the Draw B tab to design the overlay for the duplex.
Elements of an Overlay
Geometric Shapes

To draw a geometric shape, select the corresponding icon in the Shape tab. Hold the button of your mouse down and drag your mouse to define the shape and place it on the page. Give it the height and width you would like by dragging your mouse. Then, release the mouse button.
Once the shape is drawn, you can select it, move it around and change its properties (size, outline, filling).
Designer also features a variety of preset, more complex shapes you can select by clicking on the Shape icon:

Different types of shape fillings are available in the object properties:

Texts

To insert a text box, select the Text icon then hold the button of your mouse down where you want the box to be placed. Using the same method as with the geometric shape, drag your mouse to adjust the height and width of the box. Once you have released the mouse button, write your text and format it as you wish (font, size, colour, bold, aligned / justified…).
Images

To insert an image, select the Image icon and hold the button of your mouse down where you want the image to be placed. Give it the height and width you would like by dragging your mouse.
Once you have released the mouse button, a windows opens and asks you to select the Image file you want to insert. All you need to do is select the right file.
The image you selected will then be added to the overlay of the project. You can choose to keep the original dimensions of the file or alter them.
Static table

Using this tool, you can insert a static table into the overlay, you will have to define its properties upon creating it.
To add a static table, select the Static table icon and hold the button of your mouse down where you want the table to be placed. Once you have released the mouse button, a window opens and asks you to define the various parameters of the rows and columns such as their height, position, number, colour, titles...
Tables can also be inserted without specifying the dimensions beforehand, to do so follow the process detailed in 8.5. Draw a table.
Dynamic Part (Map Tab)
Definition
The Map part of a project corresponds to the dynamic part of designs that are made according to the datastreams processed by the template. The main elements which can be placed in this part are data files printable information.
To design this part, select the "Map F" tab (and "Map B" for the duplex of the document). In this view, elements of the "Draw" part are displayed as watermarks so that positioning the data to be printed is easier.
"Spooled File"
To retrieve and identify data to be printed, designing a Designer project is done using an example file. This example file is an image of the production spooled file to format.
Designer supports two types of data files in native mode: paginated text files and XML files in Mapping format. Input file types are configured in the project properties.
Designer processes files with .PAG or .TXT extensions. Text files usually have a ".PAG" extension because they need to be paginated. Text files can be paginated by running the "MAPPAGIFS" command in Onyx Server where an argument specifying the number of lines per page ("Overflow") will be given.
XML files need to respect a particular syntax so that the application can properly process them. (see 6.3 XML Mode: syntax and specifications).
To open and display an example file in DESIGNER, the spooled file view needs to be activated in the Display Menu:

In the "Home" tab, click on ![]() and select the file you want to load in the application.
and select the file you want to load in the application.
The spooled file view then displays the data from the spooled file to format.

![]()
To help you design your project, you can preview the result without having to print the document. To do so, click on the Preview button in the Home menu.
XML: syntax and specifications
In XML mode, the design principles are the same and are put in application using an example file loaded in the application.
As stated in 4.2. Creating a project, to load a .xml document, it is important not to forget to go to the project Properties and check that in Parameters > Mode = XML.

The Spooled file view is then called the XML view and displays the content of the file in a tree view.

Data structure
XML files that are processed by Designer in native mode have to respect a specific pattern and syntax, such as:
<page name="..."> … </page> tags mark out the pages of the document. In the last example, there is only one page.
- <field name="...">value1</field> tags correspond to unit-based information (the equivalent of ‘zones’/'fields' in Designer).
- <group name="..."> … </group> tags refer to a particular number of lines which contain zones, such as a ‘group’ in Designer.
- <line name="…"> … <line> tags correspond to the lines inside of these groups.
If we were to use this structure with a paper invoice:
- <page name="..."> … </page> corresponds to the pages of the invoice.
- <group name="..."> … </group> marks out the body of the invoice (from the first line to the last).
- <line name="…"> … <line> describes every line in the body of the invoice.
- <field name="...">value1</field> can correspond to two things:
- If this tag is on the outside of a group, it corresponds to unit-based information in the invoice. In which case, value1 corresponds to the invoice number in the header, for instance, or to the client number, the type of invoice, etc.
- If this tag is inside a group, value1 corresponds to the value of the zone in the line. For instance, the product code, its name, price, etc.
XML pattern specifications
The specifications needed for Designer to process the file are the following:
The XML header needs to specify the file encoding.
Example : <?xml version="1.0" encoding="UTF-16" standalone="yes" ?>
The root tag of XML data needs to be called doc.
All tags mentioned hereafter need to have at least one attribute named name. Information will be identified, retrieved and formatted by the application via the use of this attribute.
The tags and attributes names are case-sensitive and need to be written in lowercase letters.
For the application to access it, data must be placed in pages in between the <page name="…"> and </page> tags. One document can contain several pages.
Inside a page, data is organised per unit-based fields (balise <field name="…">) or per information groups (balise <group name="…">).
Information groups are composed of lines (balise <line name="…">).
The lines contain unit-based informations (balise <field name="…">).
Here is an example of an XML file:

XML data can be placed on the outside of a page as information linked to the overall document and not to the page in particular. However this data will not be accessible to Designer and thus cannot be processed to design the document. Nonetheless, this data can be used in the M-Processing Server engine.
XML view in Designer

An XML example file is loaded in DESIGNER in the same way that is use to load a text file. In the XML view, data is displayed as a list of elements.
Page break on an XML field value
In the Proprieties of a group, generating a page break can now be triggered based on the change in value of the XML field.
For example:
<group name="groupe">
<line name="ligne">
<field name="id">1</field>
<field name="data"> data </field>
</line>
<line name="ligne">
<field name="id">1</field>
<field name="data"> data </field>
</line>
<line name="ligne">
<field name="id">2</field>
<field name="data"> data </field>
</line>
<line name="ligne">
<field name="id">2</field>
<field name="data"> data </field>
</line>
…
</group>
In this example, if the field used to generate a page break is the field "id" then the page break will be generated after the execution of the second line.
There are several options in the interface for the Page break parameter:
![]()


- None: the group does not generate any page break.
- Limit: the group triggers a page break based on a positioning limit.
- XML Field: the group triggers a page break based on the change in value of an XML field.
- Limit and XML Field: the group triggers a page break based on a positioning limit and on a change in value of an XML field.
When generating automatic page breaks, managing the recovery of headers is possible with the options "Header" and "Last header":

- Header: to choose the name of the line of the XML file which acts as header.
- Last header: if checked, only the last header is kept. The box is checked by default.
When generating a page break, the last header (or all of the above headings, if the option is unchecked) are used at the start of the new page.
In the XML file, if two header lines follow each other, they are considered as one single header.
If a page break is triggered just after a header line, that header line is not printed and is moved to the next page.
f
To display a list of items in an XML group as a table, the script tool must be used.
The rowtotable feature rearranges the lines of a group so as to obtain a horizontal distribution of the elements.
Syntax:rowtotable(name of the group, maximal number of columns in the table);
The rowtotable feature has two settings:
- Name of the group: contains the name of the group to be reorganized in a table, framed by double quotes.
- Maximal number of columns in the table: Maximal number of columns in the table.
Note: All the lines of a group should have the same name.
For example:
<group name="invoice">
<line name="item">
<field name="name">item 1</field>
</line>
<line name="item">
<field name="name">item 2</field>
</line>
<line name="item">
<field name="name">item 3</field>
</line>
<line name="item">
<field name="name">item 4</field>
</line>
<line name="item">
<field name="name">item 5</field>
</line>
<line name="item">
<field name="name">item 6</field>
</line>
<line name="item">
<field name="name">item 7</field>
</line>
<line name="item">
<field name="name">item 8</field>
</line>
</group>
To rearrange this group in a three-column table, use the following script:
rowtotable("invoice",3);
This script will effectively change the group which then becomes:
<group name="invoice">
<line name="item">
<field name="name_1">item 1</field>
<field name="name_2">item 2</field>
<field name="name_3">item 3</field>
</line>
<line name="item">
<field name="name_1">item 4</field>
<field name="name_2">item 5</field>
<field name="name_3">item 6</field>
</line>
<line name="item">
<field name="name_1">item 7</field>
<field name="name_2">item 8</field>
</line>
</group>
Dynamic elements
This part of the documentation presents the basic elements that can be added in the dynamic part of a project in order to get started with the main features of the application.
Zone
Definition
A zone is the main element, which allows you to retrieve information in the input data in order to position and format them in the final graphical document.
In text mode, the information is identified by the following three elements of data:
- a row number,
- a column number,
- a length.
In XML mode, it is identified by the name of the XML field (field tag).
A zone can only read one row at a time.
It is represented in the following two ways in the designing space:
- The zone is empty, no data is associated with it: an icon appears in its upper right corner.
![]()
- The zone is associated with an element of data, it appears without an icon.
![]()
A zone is identified by its name, defined in the properties window (see a.2 Creating a zone for more details).
Creating a zone
There are two methods you can use to create a zone:
Select the corresponding icon and its type in the Data tab and hold the button of your mouse down where you want the element to be placed. This method creates an empty zone. To link the zone to an element of data from the source file, select the data in the spooled file view (see the second method below) then, drag and drop it in the zone which was created previously, by holding down the Ctrl key.

Select the data to be recovered in the Spooled file view then, drag and drop it where you want, in the designing space to create a zone automatically linked to the data you selected.

Once the zone has been created, select it and display the 'Properties view to fill in the following information:

Name :
Name (of the zone): this information is used as internal information in Designer, it identifies the different objets in the project. When creating the zone from the data tab, this field is empty, its value is given by the data linked to it from the Spooled file view.
Text printed before/after: to add text before and/or after the retrieved information.
Position :
Position of the information in the data spooled file: column, length, beginning line.
This is also used to extract a certain quantity of information in XML mode.
Position in the document:
to change the position of the zone on the page.
Data Type:
defines how the Designer application processes the information retrieved (see a.3 Types of zones).
Font:
To set all formatting options: font, size, colour, framing, orientation, etc.
Types of zones
The Designer application offers various processing options according to the type of data to process:
- Text: prints plain text.
- Normal: copies the values located in the positions defined by the zone whether they are letters, numbers or blanks.
- Optimized: copies the characters located in these positions except for blanks at the beginning and end of these positions. The framing to the left or to the right is always observed. There is no shift due to blanks in the spooled file.
- Substitution: used to replace a value of the spooled file with another one stored in a file called replacevalue.txt. By default, this file is in its blank state in the Designer installation folder. To carry out the substitutions, place it in the lgobitmap folder. The folder needs to contain the values to be replaced followed by replacement values and separated by a tab. This sub-type is explained in further detail in 8.3. Replacing characters.
- Translate: substitutes a value for its translation in another language. A zone type Tools / Set Lang is used beforehand to define the file with the translated values. The program searches for the corresponding input in the translation file for each Text / Translate zone which is defined in the template. The file must be placed in the lgobitmap folder and its name must start with "Translate_".
- Compressed: zone displaying the recovered text into the dedicated space. The text occupies the width of the zone and adjusts the font size between a maximum and a minimum so that the text covers all the dedicated space.. If the minimum font size does not display the entire text, it is truncated and followed by "…".
- Truncated: zone displaying the recovered text into the space allowed by the zone width. If the text cannot be fully displayed, it is truncated followed by "...".
- Barcode: encodes and prints barcodes. The list of available barcodes can be seen in 8.1 Barcodes
- Tools: inserts a page number, images, … but also displays the total number of pages, pages in the current batch, …
- Page Number: numbers each edited page. The page number is not necessarily the same as that in the original spooled file. If M-Processing Server is set to exclude certain pages, the number of edited pages will not necessarily be the same as the number of pages in the original spooled file.
- Batch Number: displays the batch number.
- Page Number (Batch): displays the page number in the batch.
- Total Number of Pages: displays the number of pages in the document.
- Total Number of Batches: displays the number of batches in the document.
- Total Number of Pages (Batch): displays the number of pages in the current batch.
- Specific replacement: replaces a value in the spooled file processed by another value which was retrieved in a file. For example, the customer number displayed in the spooled file can be replaced with the customer's name which is retrieved in a database file.
- Image: prints out a different image depending on the value of the spooled file.
- Export: this type of zone allows you to retrieve information from the spooled file and export it to a physical file.
- Repl. File: retrieves text in a file. The name of the zone must correspond to the name of the file. The file must be in the lgobitmap folder and be called data_NAMEOFTHEZONE.txt (where NAMEOFTHEZONE is the real name of the zone). The row and length settings of the zone indicate the row and length of the text to be retrieved.
- Input Text: creates interactive input fields to design SOAP forms in PDF or HTML format. As the user opens the form generated in Adobe Reader or a web browser, he can fill in input fields and send data to an M-Processing Server URL in a Web entry point by clicking on the SUBMIT button, which is actually a Tools / Input Text zone called SUBMIT (system name).
- HyperLink: adds a URL link.
- Set Lang: to specify the file which contains the translations. The latter must be in the lgobitmap folder and its name must start with Translate_. This zone is not printed in the final document, it cannot be seen for preview nor mapping. The name of this zone is not really important, however it must be declared before any other Designer zone that requires translation. Then, the program searches for the corresponding input in the translation file for each Text / Translate zone defined in the template.
- XPS Message: Inserts an XPS file in the current page. This zone is a link to an XPS file which is on the M-Processing Server. This file must only contain one page and must also be placed in the lgobitmap folder (directly or in a sub-folder). It is not case sensitive. If changes are made to the XPS file, it will impact the projects that use it.
- XPS File: unlike XPS Messages, the files inserted with XPS File zones:
- can contain several pages.
- are whole pages.
- create additional pages in the output file.
- Metadata: indexes the document for archiving (non printed data). The length of the metadata is unlimited.
- Index: index zone by default, used in XPS manipulations and in M-Storage Manager as criterion.
- MapFrom: index reserved to send emails. The value of this zone will be used to specify the email sender.
- MapSend: index reserved to send emails. The value of this zone will be used to define the address of the recipient.
- MapCopy: index reserved to send emails. The value of this zone will be used to specify the copy recipient.
- MapBCopy: index reserved to send emails. The value of this zone will be used to define the recipient in hidden copy.
- MapNote: index reserved to send emails. The value of this zone will be used to define the body of the email.
- MapSubject: index reserved to send emails. The value of this zone will be used to define the mail subject.
- MapOrg: index reserved to send faxes. The value of this zone will be used to identify the sender.
- MapTo: index reserved to send faxes. The value of this zone will be used to define the recipient.
- MapUser: index reserved to send faxes. The value of this zone will be used to identify the owner.
- MapFormat: index reserved to send faxes. The value of this zone will be used to define the document format (.BMP, .JPG, .EXE, .PAG, .PDF, .TIF, .TIF_FAX, .TXT, .XLS).
- Memory: inserts and stores information (not printed) which will later be recovered and used in the template. (see 8.1.b. Combined data)
- Text: saves alphanumeric information and deletes the spaces after the text.
- Text with spaces: saves alphanumeric information and keeps the spaces after the text.
- Integer: saves integer-type digital information.
- Float: saves floating-type digital information.
- SQL: saves alphanumeric information found in a database using an SQL query.
- Protect SQL: saves alphanumeric information found in a database using a protected SQL query.
- Math. calculation: uses memory zones to perform a calculation.
- Memory Replacement: retrieves information saved in the memory zone.
- Memory Translate: saves alphanumeric information resulting from the automatic translation of the information retrieved in the spooled file.
- Graph: used to generate a graph using multiple elements of data
- Graph data.
- X-axis data.
- Y-axis data.
- Graph title.
- X-axis title.
- Y-axis title.
- Legend data.
- Minimum value of the Y-axis.
- Maximum value of the Y-axis.
- No. of intervals of the Y-axis.
- Rounding up/down to the nearest integer number on the Y-axis.
- Intercept of the Y-axis.
The construction of a graph is detailed in section 8.6. Drawing a graph.
Designer can automatically convert old graph types in complex graphics. This feature facilitates the conversion of old projects in XPS projects.
- Conversion: converts numerical data according to conversion rules (Euro to Dollar for example) defined in Onyx Server > Managing Designer Formats > Managing Rates (01=E1 ; 02=E2 ; …)
- XPS PrintTicket:
- Copy: number of copies to print.
- Input Bin: input bin number (printer paper feed).
- Output Bin: output bin number.
- Media Type: Type of paper (A4, A5, etc...).
- Force Front Side: determines the mode Simplex/Duplex when printing.
- Commands: adds data in the print stream, in printer language. As for the project properties, Document and Page (see 4.2. Creating a project), a "Commands" zone defines the printer language data for the following languages: PCL5, APFDS, PDF, ZPL, DPL, TEC, IGP, IPL and EPL. A zone can contain data for several different languages. When converting the XPS to the output language, the corresponding data to the output language will be used.
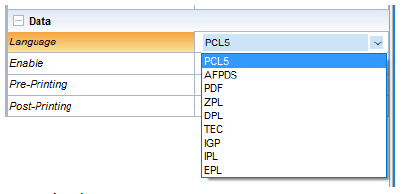
Language: select language.
Activate: enable zone for the selected language.
Pre- and Post-Printing: Data written before and after the retrieved data from the spooled file.

Writing hexadecimal data in the "pre-" and "post-printing" can be done using the following syntax: \x followed by the hexadecimal value of two characters.
Groups
Definition
A group can be used to retrieve several rows of a spooled file. It is defined by a beginning row and an end row. It is shown in red in the designing space:

A group can be fixed (fixed beginning and end rows) or variable (variable beginning and end rows).
Creating a fixed group
The creation of a fixed group, is similar to the creation of a zone.
- Create an empty group from the Ribbon menu, select the data of the source file, drag and drop it in the group you created beforehand while holding down the Ctrl key.

- Select data in the Spooled File view, use the drag and drop method to place it in the designing space to create a group automatically which is linked to the zone you selected in the spooled file.
Once the group is created, its informations must be specified in the Properties view:

Name:
- Name (of the group): this information is used as internal information in Designer, it identifies the different objets in the project. When creating the group from the data tab, this field is empty, its value is given by the data linked to it from the Spooled file view.
- Position in the document:
- Used to change the position of the group on the page.
- Position:
- Identifies the beginning and end rows in the block of information to recover.
- Offset: prints the position of the first row in relation to the group
- Option:
- Exclusive conditions: For one row of the group, a true condition will be executed exclusively without testing the following rows
- Table: allows zones of a group to behave like the cells of a table. Zones of the same line find themselves automatically linked. Resizing or moving a zone impacts the size and the position of the adjacent zones. In addition, the group's lines (or conditions) are visually represented in the designing window. The zones are vertically distributed according to their line. This option is detailed in 8.5.b. Drawing a dynamic table.
- Variable:
- Used to change the type of group: from fixed (the beginning and end rows are static) to variable (the beginning and end rows are variable and defined by conditions).
If the user requests a preview, no information will be printed. Indeed, a group only defines the limits between which the data is to be retrieved from the spooled file.
Given that the limits of the data selection zone are defined using the Beginning line and End Line fields of the group, the data must then be retrieved by creating one or more Zones inside the group.
In short:
- The selection zone of the data block is configured by creating a Group:
The data is retrieved inside this block of data by creating a Zone:

- All the rows of our block of data are retrieved using the preview function (Ctrl+w). Several Zones can be created from the data block, they can then be placed in the group and their formatting can be conditioned (see 6.4.c. Conditions).

Creating a variable group
A variable group uses the same principles as a fixed group i.e. it can be used to retrieve several rows of information in the spooled file. A variable group is used when the beginning or end row of the group is not always at the same place in the spooled file or if you do not want the information to always be printed at the same place on the page.
A variable group uses a start condition and an end condition. The group begins to run when a condition is validated and it stops when another condition is validated or when it has executed a certain number of rows. A variable group can be executed once or more times in the page.
The position of the values printed by a variable group can be variable.
For example, you can define the settings so that the values printed by a group are positioned after the values printed by another group. We refer to this as relative positioning.
You can also define the settings so that the invoice total is always printed one centimeter after the last product row (whether there are 5 or 20 rows). The position of the invoice total will therefore change according to the number of product rows in the invoice, for instance.
A group may vary in:
- size: the beginning and end rows are dynamically set by the conditions,
- print position: variable groups can be linked one after the other so that the following group is printed straight after the current group has been printed.
These two types of variable can exist separately or jointly.
To create a variable group, simply click the ![]() icon and draw the group in the designing space.
icon and draw the group in the designing space.
The Properties view is displayed so that the group information can be entered:

- Name:
- Name (of the group): this information is used as internal information in Designer, it identifies the different objets in the project. When creating the group from the data tab, this field is empty.
- Position in the document:
- Used to change the position of the group on the page.
- Position:
- Offset: prints the position of the first row in relation to the group.
- Option:
- Exclusive conditions: for a row of the group, a true condition will be performed exclusively without testing the following rows.
- Repeat: if the start condition appears several times, the group will run several times provided that the end condition has been validated in the meantime.
- MapOffice: used to check the design of a MapOffice group (see the Connect documentation on designing Office documents).
- Table: allows zones of a group to behave like the cells of a table. Zones of the same line find themselves automatically linked. Resizing or moving a zone impacts the size and the position of the adjacent zones. In addition, the group's lines (or conditions) are visually represented in the designing window. The zones are vertically distributed according to their line.
- Variable:
- Used to change the type of group: from fixed (the beginning and end rows are static) to variable (the beginning and end rows are variable and defined by conditions).
- Spacing: spacing before the printing of the group.
- Type of stop condition: used to condition the end of the execution of the variable group.
- Previous group: Indicates after which fixed group the variable group is run.
Conditions
Execution conditions
Execution conditions are used to execute, or not to execute, the object conditioned in accordance with a value in the spooled file.
A condition can apply to a page, a component, a group, a zone, a line or a rectangle.
If the condition is valid, the object is executed. Otherwise, no further action is taken. In order to complete two different actions depending on the presence of a spooled file value or not, you must create two objects.
Example: If you want to write in black for an Invoice value and in red for a Credit Note value in a spooled file row, you need to create two zones. One with a black font when the value is Invoice, and one with a red font when the value is Credit Note because you cannot apply two conditions to the same particular zone: "black font if Invoice and red font if Credit Note" is not possible.
The conditions are managed differently if the object is fixed or if it belongs to a group. Indeed, in a group, the condition is named and linked to the group. Therefore, we can associate multiple objects to a single condition without having to re-enter the latter each time.
Start condition
The start condition defines the first row for the execution of the variable group. The group begins to run on the row where the start condition is true.
Onyx Server tests the validity of the condition from the first row of the spooled file (row 1). As soon as the condition is verified, the group begins to run. It stops when the end condition is also verified.
The start condition is also used to define if the group is to be printed at a fixed position on the page or in relative positioning in relation to another group. It is also possible to set it so that the group is printed one centimeter after the end of an other group.
If the start condition for the group is not verified on any of the rows of the spooled file, the group is not executed.
If the start condition is verified on several rows of the spooled file, the group runs only once: from the first row where the condition is verified.
End condition
The end row of a variable group can be defined in two ways:
- number of execution rows,
- end condition.
By knowing the number of rows for which the variable group must run, it is possible to set the input number after you have checked the Number of lines box.
The stop condition does not consist in a comparison test in relation to a value present in the spooled file but in a comparison test in relation to the row number after which the group stops.
The end condition defines the last row for the execution of the variable group. The group stops running on the row where the end condition is true. This row can be excluded (non executed) or included (executed).
Exclusive condition
In a group, it is possible to manage several conditions. By default, there is only one which is the None condition that applies for all newly created zones. That condition is always TRUE (valid).
Example:
In a group containing product rows, there may be rows of sub-totals. It is possible to use several zones to print these different types of rows (to display the sub-totals in bold for example) using a condition.
In this case there are basically two conditions: a Sub-total condition, which is linked to at least one zone that prints in bold and the None condition, which is linked to the zone that has standard writing for the product rows.
If the group operates using exclusive conditions, one single condition is applied per row, even if several are true (only the first created condition is applied). The product rows are printed as standard by the zone under the None condition and the rows of sub-totals are printed in bold by the zone under the "Sub-total". condition.
If the group operates using non-exclusive conditions, all the verified conditions are applied by row. In this case, the sub-total rows are printed twice, once in bold by the zone under the Sub-total and once as standard by the zone under the None condition. Indeed, the None is always true as mentioned before.
If the group operates using non-exclusive conditions, all the verified conditions are applied by row. In this case, the sub-total rows are printed twice, once in bold, by the zone with the Sub-total condition and once in standard setting by the zone with the None condition. Indeed, the None condition is always true as mentioned before.
The None condition cannot be deleted. If you do not want to use it, do not link it to an object.
Comparison type
When setting the conditions, you can test:
The existence in the row: there is in a row or in the entire page.
The non-existence in the row: There is not in a row or in the entire page.
Strictly greater than (numerical): >.
Equal to or greater than (numerical): =>.
Strictly less than (numerical): <.
Equal to or less than (numerical): =<.
The number of the page.
The number of the row.
These tests will allow Designer to validate or not to validate a condition.
Generating a project
Once the template is completed, all you need to do is generate it to use it in Onyx server.

To do so, click on the Project button of the Home menu.
At this stage, make sure you have properly configured the server in Preferences.
The Save Project windows opens, check that the generation path is correct. By default, the project is generated in the docpc folder in the Import folder.
- Unix: /apps/mapping/import/docpc/
- Windows: C:\Mapping\M-Processing Server\Import\docpc\

A post-generation window is displayed once the project is generated, to show you the result(s) of the generation.

The template is now ready to be imported into Onyx Server.
Advanced features
Barcodes
Creating barcodes
To create a barcode in Designer, create a zone type Barcode and select the barcode sub-type you want.
Types of barcodes
- EAN 8 This barcode is used to track logistics units and identify stock keeping units. The eight characters version is used for small sized packages. The data must contain seven digits. The eighth character is a control character which is calculated by the computer.
- EAN 13 This barcode is used to track logistics units and identify stock keeping units. In an EAN 13 code, the first two characters indicate the country of origin, the other 10 are data and the last is the control character which is calculated by the computer. The data characters must contain 12 digits.
Code 39
This barcode is used to encode alphanumeric data. It is used in almost every industry except the retail sector. Data may be of variable length and may contain letters and digits.
The information can be of any length and contain digits, uppercase letters and the "space", "plus sign", "minus sign", "division", "dot", "percentage" and "dollar" characters.
- Code 128 allows general alphanumerical data and ASCII data to be encoded. These codebars are used in numerous industries for stock management purposes. Data is of variable length. The Code 128 C must contain an even number of characters (otherwise a zero is added at the beginning of the barcode) and may only contain digits. The Code 128 B accepts all ASCII characters, whereas the Code 128 A accepts only some of them. The information to encode can be of any length and composed of:
- Optimised: digits, uppercase letters, lowercase letters, printing or non-printing ASCII characters (0 - 128), and all the function signs and characters provided by the Code 128 in the A, B and C code sets, with systematic length optimisation
- N/optimised: digits, uppercase letters, lowercase letters, printing or non-printing ASCII characters (0 - 128), and all the function signs and characters provided by the Code 128 in the B code set, without length optimisation
- Digital: digits and control character provided by the Code 128 in the C code set, with systematic length optimisation
- Code 2/5 interleaved This encoding of numbers uses density to meet precise characteristics. The security of this symbology is weak, except when using optional security measures (control character, messages of fixed length that are checked when scanning).
- Although the length of the barcode is unlimited in terms of the number of characters, the principle of interleaving requires the following:
- An even number of digits when the optional control character is not used
- An odd number of digits when the optional control character is used
- Code 2/5 industrial This old symbology was frequently used in industry, particularly the automotive industry. The security of this symbology is weak, unless it is used with messages of fixed-length and checked when scanning.
The data must contain 1 to 32 digits
- The digital information encoding is designed with regards to ease of use
- Development or modification of pre-existing applications
- EAN128 Alpha n/optimised Code GS1-128 Used to identify dispatch units (pallets or cardboard boxes).
- Encoding of alphanumeric information,
- Variable length,
- Continuous bidirectional self-controlled.
- EAN128 digital Code GS1-128 Used to identify dispatch units (pallets or cardboard boxes)..
- Encoding of digital information,
- Variable length,
- Continuous bidirectional self-controlled.
- PDF 417 Used in every business sector. The PDF417 code is the only two-dimensional barcode that can be scanned using a simple linear scan (1D) due to the fact that, as stacked linear symbology, it has the features of linear barcodes as well as those of two-dimensional ones.
- Two-dimensional,
- Alphanumeric 2000 length,
- Eight levels of security.
- Data Matrix This code can encode up to 2335 characters. Various types of encoding are available (ASCII, C40, text and Base 256). The default mode is the automatic mode which can be used to optimise the encoding by switching from one mode to the other depending on the data. It also has an error detection/correction system to repair any damage.
- Postnet The Postnet barcode is used by the United States postal service. It has been replaced by the USPS or Intelligent Mail barcode.
- Planet The Planet barcode is used by the United States postal service. It has been replaced by the USPS or Intelligent Mail barcode.
- QR Code It has the particular feature of being able to encode a very large number of characters (7336 in numeric mode). This type of barcode is very widespread in Japan. There are four types of encoding (alphanumeric, numeric, bytes, Kanji) to compress data depending on the type of data. By default, an automatic mode is used to choose the encoding method that will give the best compression rate (switch of mode while processing). Error detection/correction codes are added to the data, which are used to prevent the loss of data in the event of damage. There are four levels of error detection/correction.
- MaxiCode The MaxiCode barcodes, developed by UPS - United Parcel Service, are defined by the ISO 16023-2000 standard. Unlike the others, its size is fixed, which limits the number of characters to be encoded. Indeed, the maximum number of characters is 93 alphanumeric characters or 138 numeric characters. There are two types of encoding. The first only encodes a string of characters, containing data, according to a conventional type of encoding and a standard type of error detection/correction. The second type encodes the following three fields in addition to the string of data: the country which is encoded using 3 digits according to the ISO 3166 standard, the postal code which is encoded using 6 characters and finally a type of service using 3 digits. These three fields are encoded using an extended error correction mode contrary to the string of data whose correction mode is standard.
- Japan Postal The Japan Postal barcode is used by the Japanese postal service.
- Codabar (NW7) In Japan, the Codabar Monarch is also called NW-7. Because of its relatively simple composition, the Codabar Monarch is frequently used to encode serial numbers in blood bank transfusion services, home deliveries, libraries, etc.
- USPS USPS = United States Postal Service. The more commonly used official name is the Intelligent Mail Barcode. It is the new American postal barcode, which is to replace the Planet and the Postnet. The Intelligent Mail barcode is a 4-state barcode composed of 65 bars.
- UPC-A The UPC-A barcode is an american counterpart of the EAN13 barcode, with a 0 as its first number. It is used primarily to identify products in store. The UPC-A barcode can encode 11 digits, a number system with five digits for the Manufacturing Code and five digits for the product code. A 12th digit is calculated using the first eleven in order to act as a control character.
- UPC-E The UPC-E barcode is a short version of the UPC-A barcode, in which the ten digits of the UPC-A barcode (manufacturing and product code) are reduced to six digits by removing unnecessary zeros. With the Number System and the control character, a UPC-E barcode is therefore composed of eight digits. Designer can be used to include UPC-A (11 digits) barcodes in the UPC-E format as well as a code reduced to 6, 7 or 8 digits.
- MSI The MSI barcode is used primarily for stock management, marking storage containers and shelving in warehouse environments. An MSI barcode uses one or two control keys calculated using the Modulo 10 or Modulo 11 and is used to encode numeric values with non fixed sizes. Designer can encode using either a Modulo 10 control key, a Modulo 11 control key, two Modulo 10 control keys, or a Modulo 11 control key followed by a Modulo 10 control key.
Size of the barcode
The size of the barcode can be defined in the following two ways:
- The first involves choosing the Fit the area option in the Properties view, in which case the barcode will adjust as well as possible to the size of the zone, according to its standard
- If the Fit the area option is unticked, the size of the barcode can be set by the size of the font of the zone. This size affects the width and the height of the code. The height can be reduced by reducing the percentage of the height setting of the zone.
Combined data
It is possible to combine data found in different places in the spooled file within a single barcode. In order to achieve this, it is necessary to create as many memory zones as there are elements of data to be retrieved from the spooled file and then all these zones must be combined in the label of the barcode zone.
- In the Map F tab:

- In the Properties view:

- In this example, the Memory zones have the values:
- MEM_FACT: 0012601
- MEM_DTFACT: 14/10/99
- Outcome:

It is also possible to add text that is not found in the spooled file using the Memory zones (detailed in 6.4.a.3 Types of zones) : [[MEM1]]TEXT[[MEM2]].
If you use replacement zones in a Barcode zone, the length of the barcode must be equal to 0.
Special case: EAN128
The encoding of the EAN128 is identical to the encoding of the Code128. That is why we use the same fonts. The difference is that the EAN128 is structured in order to standardize the information that it contains. To achieve this, an AI (Application Identify) is inserted between each piece of information, which is used to identify the data encoded.
Structure of the EAN128: START FNC1 AI DATA (FNC1) AI DATA .... (FNC1) AI DATA CRC END
FNC1: Separator character of the EAN128.
AI: an Application Identifier, is used to encode several standardized elements of information in one code (date+time+etc.).
The first FNC1 is automatically added by Designer. It is required as it is used to differentiate an EAN128 barcode from a CODE128 barcode.
However, the following FNC1 are optional. Indeed, they are only required when the previous element of data does not have a fixed length, in which case they are used to separate each element of data.
If you want to insert the FNC1 character, you have to put the {FNC1} character sequence in your spooled file. These characters will automatically be replaced with FCN1 characters by MAPPING.
E.g. SPOOL ----> MAPPING
AI DATA ----> START FNC1 AI DATA CRC END
AI DATA {FNC1} AI DATA ----> START FNC1 AI DATA FNC1 AI DATA CRC END
If you cannot change your spooled file to add the "{FNC1}" characters or if you want to combine several elements of data that are located in different places in the spooled file (see previous paragraph: 8.1.b. Combined data), use memory zones.
Special case: code 128
There are three encoding modes for 128 barcodes:
- mode A (alphanumerical),
- mode B (alphanumerical). The code 128 Alphanumeric encodes in B mode,
- mode C (numerical). The code 128 Alphanumeric encodes in C mode.
The code 128 Alphanumeric Optimized switches from B mode to C mode automatically in order to optimize the size of the barcode.
However, your barcode may have to respect a specific type of formatting, i.e. a certain number of characters in A, B or C mode.
For example, the barcode that corresponds to the mail tracking ID of "La Poste" contains 13 characters. The first three must be encoded in B mode and the last ten in C mode.
In order to create this barcode using Designer, you must create a "Code 128 N/Optimised" type zone and then enter a formatting screen in the Advanced options of the zone.
Example:
For the following data: 1J45034500751
You want to encode:
- the first three characters (1J4) in B mode
- the last ten characters (5034500751) in C mode
Your formatting mask must therefore be BBBCCCCC.
You will notice that although there are ten digits to be encoded in C mode, there are only five 'C's in the formatting mask. This is due to the fact that one character in C mode encodes two digits.
Special case: 2D Codebars
Currently, MAPPING manages four types of 2D barcodes: PDF417, DATA MATRIX, QR CODE and MAXICODE.
If "Fit the zone" is checked, the "Barcode width" setting is used to change the size of the barcode. In this case it should be noted that the size of the barcodes can vary in height and width depending on the content to be encoded.
The benefit of 2D barcodes is being able to encode a number of important pieces of information. If the data that you need to encode is located in different places in the spool, go to section 8.1.b. Combined data to combine them in a single barcode.
QR code
The QR CODE barcode was developed according to the International ISO/IEC 18004 standard. It has the particular feature of being able to encode a very large number of characters (7336 in numeric mode).
This type of barcode is very widespread in Japan. It is already used in the industry, but has also been adopted by the general public eversince mobile phones know how to decode it.
There are four types of encoding (alphanumeric, numeric, bytes, Kanji) to compress the data depending on the type of data. By default, the automatic mode is used to choose the encoding method that will give the best compression rate (switch of mode while processing). For example, let us assume that the beginning of the string contains alphanumeric type data. As soon as the program detects a string of at least 13 numeric characters, it changes encoding mode.
Error detection/correction codes are added to the data. These codes prevent the loss of data in the event of damage. There are four levels of error detection/correction. By default, level three is used, its codes use approximately 25% of the final barcode.

Advanced options available:
- Barcode width: Value between 1 and 15 specifying the size of the barcode.
- Error Level: (7%, 15%, 25% and 30%).
- FCN1:
- ECI protocol not implemented.
- ECI protocol not implemented, FNC1 implied in first position.
- ECI protocol not implemented, FNC1 implied in second position, in this case, a separator character (Application identifier) must be specified.
- Application Identifier: Separator character, used only with the implicit FCN1 in second position.
- Type of encoding:
- AUTO: Automatic encoding of the data with a switch in mode depending on the data.
- ALPHA: Alphanumeric encoding.
- NUMERIC: Numerical encoding.
- BYTE: Encoding in bytes.
DATAMATRIX
The Datamatrix barcode is defined by the International ISO/IEC 16022 (ECC200) standard. This code can encode up to 2335 characters.
Various types of encoding are available (ASCII, C40, text and Base 256) and the default mode is the automatic mode that can be used to optimize the encoding by swapping from one mode to the other depending on the data.
It also has an error detection/correction system to repair any damage.

Advanced options:
- Barcode width: Value between 1 and 15 specifying the size of the barcode.
- Type of encoding:
- AUTO: Automatic encoding of the data with a switch in mode depending on the data
- ASCII: The ASCII encoding is a tacit plan for encoding the ASCII data.
- C40: C40 encoding transforms 3 alphanumeric characters into two code words.
- TEXT: The Text encoding is used to encode the lowercase characters.
PDF 417
The PDF 417 is defined by the International ISO/IEC 15438 standard. This type of barcode can encode up to 2700 numeric characters.
There are three types of data encoding (alphanumeric, numeric and bytes). The automatic mode chooses the best compression rate and changes the mode while encoding.
There are also eight levels of error detection/correction mode. In automatic mode, the level is chosen according to the number of characters to be encoded.
![]()
Advanced options:
- Barcode width: Value between 1 and 15 specifying the size of the barcode
- Error Level:
- AUTO: automatic choice.
- 0 - 8
- Compact mode: Activation of the compact mode or not.
- Ratio: Used to determine the height/width ratio of the barcode.
- Fixed columns: Used to define the number of columns.
- Fixed rows: Used to define the number of rows.
The selection of a ratio prevents you from specifying the number of rows and columns.
UPS MAXICODE
This type of barcode, developed by UPS - United Parcel Service, is defined by the ISO 16023-2000 standard. Unlike the others, its size is fixed, which limits the number of characters to be encoded. Indeed, the maximum number of characters is 93 alphanumeric characters or 138 numeric characters.
There are two types of encoding:
- The first only encodes a string of characters containing data according to a conventional type of encoding and a standard type of error detection/correction.
- The second type encodes three other fields stored in three of Designer's memory spaces, in addition to the string of data. These fields are: the country encoded using 3 digits in accordance with the ISO 3166 standard (called MAP_countr), the postal code encoded using 6 characters (MAP_zipcod) and finally a type of service using 3 digits (MAP_servic). These three fields are encoded using an extended error correction mode contrary to the string of data whose correction mode is standard.

Advanced options available:
- Barcode width: Value between 1 and 15 specifying the size of the barcode.
Automating
Automating Designer processes allows you to create image files corresponding to the preview of a project as well as generate a project or an association of projects. All this can be done in command line, in hidden mode or not.
The aim is to set the command with a .BAT or a remote order, for example.
- -InFile: .PAG or .XML file to map.
- -OutFile: Output image file.
- -ProjectFile: Project to open (.MPP).
- -ProjectAsso: Project association to generate (.MPA).
- -MPIFile: .MPI file to open (MAP tab).
- -MPWFile: .MPW file to open (DRAW tab).
- -Hide: To launch Designer in hidden mode.
- -Color: Use of colour or not to create the image.
- -Rotation: rotation angle of the image (default: 0).
- -Resolution: Image resolution (default: 300).
- -Specimen: Adding a text above the image (text to specify in the argument).
- -Mode: Choice of the SPOOL or XML mode (default SPOOL).
- -Generate: To start generating the project indicated in the argument.
- -FtpUse: 0 = does not use FTP; 1 = uses FTP.
- -FtpFolder: FTP folder.
- -FtpLogin: FTP login.
- -FtpPassword: FTP password.
- '-FtpIPAddress: IP address of the server.
- -ShareFolder: Shared folder.
- -ServerName: Name of the server (description).
- -Rename: changes the FORMAT and SEQUENCE of the project using its name. Ex: Invoice00010.mpp.
Example 1: Project generated in PCL, in color and 300 dpi
C:\Mapping\M-Designer\M-Designer.exe "-Hide" "-ProjectFile:C:\Mapping\M-Processing_Server \Import\docpc\test.mpp" "-Generate"
When using the "-Generate" setting (indicating a project generation), the "-ProjectFile :" or "-ProjectAsso :" setting must be present to identify the project to be generated.
If both settings "-ProjectFile :" and "-ProjectAsso :" are present, the project will take priority for the generation and the association of projects will be ignored.
Example 2: creating a colour BMP image, with a 90° rotation, in 203 dpi and with the word SPECIMEN overlaid
C:\Mapping\M-Designer\M-Designer.exe "-InFile:c:\test.xml" "- OutFile:c:\image.bmp" "-ProjectFile:C:\ Mapping\M-Processing_Server \Import\docpc\test.mpp" "-Hide" "-Rotation:90" "- Resolution:203" “-Color” "-Mode:XML" "-Specimen:SPECIMEN"
The "-InFile" and "-ProjectFile" settings are required to create an image.
If "-OutFile" is missing, the output file takes the name of the input file with the .BMP extension.
The default mode is SPOOL. If the input file is an XML file, you have to specify the mode.
Caution: The quotation marks around each parameter are required.
Replacing characters
The objective is to explain how to replace a string of characters in the input file with another string of characters.
The operating principle involves using a text file as a conversion chart between the value to be replaced and the new value.
The following is required in order to use the conversion chart:
- Define the zone using the Type mode = Text / Sub-type = Substitution.

- Finish and generate the template.
- Open the ReplaceValue.txt file in a text editor (like Notepad, but not Word). The syntax of the file is:
Value to be replaced Tab New Value

In this case, the "]" character is replaced with the ">" character and the "Nom" character is replaced with the "Name" character (if the value to replace is located in a Text\Substitution type zone).
- Save the ReplaceValue.txt file in the lgobitmap Mapping sub-folder (by default /apps/mapping/import/lgobitmap on Unix)
Drawing a table
Drawing a static table
To create a perfectly drawn and aligned table without using the Static Table tool of the Overlay view:
- first, draw the rectangle that will act as the borders of the table,
- draw the vertical lines to create columns,
- draw horizontal lines to create lines if necessary (column headers for example),
- finally select all elements of your table and press the lowercase "a" on your keyboard:


Note:
This tip also applies to designing the Dynamic part of a project. You can draw a table inside a group in dynamic view, and place an execution condition on a horizontal line for instance, to draw a line dynamically for every new data row.
Drawing a dynamic table
As mentioned in (6.4.b.2. Creating a fixed group), the table mode allows the zones of the group to act as cells of a table. The zones of one line are automatically linked.
Note:
Resizing or moving a zone impacts the size and position of the adjacent zones.
The lines of the group (or conditions) are represented visually in the designing window. The zones are vertically distributed according to their line.

Drawing a graph
In the Map tab:
- Create a graph in the Graph tab:

- Name it (here, "GRAPH1"):

From there, the complex graph can be built in two different ways, detailed below.
By selecting zones one by one
- In the spooled file, select the zones which will be used in the graph,
- In the Properties for each defined zone:
- Name them all with the same name as the graph (which is "GRAPH1" here)
- Enter the Type = "Graph":

- Depending on the use made of the zone in the graph, select the corresponding Sub-type in the list:

- Go to the Graph Properties and click on Edition:

- Set your graph by choosing from the tabs:
- Type:
- Name of the graph: which will be included in the name of the zones,
- Number of zones which will lay out the graph,
- Graph type: Pie, Bar or Line chart
- Type:

NB: For the graph type = Bar chart, it is possible to define the spacing between the bars on the right and on the left (in %). This option can be used, for example, to add spacing between the bars so that a second graph can be overlaid on top of the first one.

- Properties: allows you to choose the filling, the border, the width of the outline, the filling type, …

- Positioning: allows you to place the titles (X, Y, of the graph) as well as the legend, to resize the graph according to the preferences of the user.
N.B. The print area of the graph is delimited by the large rectangle, so everything outside this area will not be visible when printing (e.g. the "Legend" area is outside the rectangle in the first image below while it is inside it in the second).


- The Legend is built by selecting zones in the spooled file which will act as legend for the chosen attributes. As with any other data, the zone must be named (e.g. give a name to the graph) and the properties of the zones must be specified with Type = "Graph" and Sub-type = "legend data".
N.B. Be careful to respect the same order as that of the attributes when selecting the zones that will be used for the legend because they will follow the same order as that of the attributes.
By creating a group
The principle is the same as that described above except that the data is assembled into a group. This is possible if the data used in the chart is arranged in continuous in the spooled file.
- Create a group that will define the data to be taken into account for the construction of the graph and add the selected zones that contain data, titles, legend …
- Name the zone(s) with the same name as the graph and enter its properties with Type = "Graph" and Sub-type according to the role of the zone (title, data, legend…).
The remainder of the graph construction is done in the same way as that described above.
Calculations in a group
To simplify calculations in group and especially the management of "total" and "sub-total", a tool has been integrated within Designer. It allows you to process an input XML file using scripts. These scripts are executed before the application of the template.


Adding calculations into a group through this tool is done using the "addline" script function. This function adds a line to a group specifying a sequence of pairs "field name/value" to add.
In addition, the "character string" type parameters must be framed by double quotes and field names in formulas by single quotes.
Syntax:
addline(name of the group, name of the line, page break type line, name of the first field, value of the first field, pre-calculation of the first field, name of the second field, value of the second field, pre-calculation of the second field, etc…);
The addline function starts by the following arguments:
- Group name: contains the name of the group where the line should be added.
- Line name: Name of the line to add.
Then, it consists of an unlimited sequence of field / value pairs:
- Field name: field name of the line.
- Field value: field value of the line.
- Pre-calculation: Boolean value (0 or 1, yes or no). If the field has a calculation then this defines when the calculation should be:
- Yes: The calculation is resolved during the script execution, taking into account all the XML values.
- No: The calculation is solved when using the value in a template and therefore only takes into account the values in the current page.
For example, the following script adds a line to the group named "group":
addline("group","line",yes,"field1","value1",no,"field2","value2",no);
<group name="group">
…
<line name="line" pagebreak=”1”>
<field name="field1">value1</field>
<field name="field2">value2</field>
</line>
</group>
If the field value contains a calculation then the syntax is:
SUM('''''operation''''') to calculate a sum over all the groups of lines.
AVG('''''operation''''') to calculate an average over all the groups of lines.
In this example, "operation is a mathematical calculation using field names in lines of the group. Field names must be framed by single quotes.
For example:
<group name="invoice">
<line name="item">
<field name="name">item 1</field>
<field name="price">10</field>
<field name="quantity">2</field>
</line>
<line name="item">
<field name="name">item 2</field>
<field name="price">5</field>
<field name="quantity">3</field>
</line>
<line name="item">
<field name="name">item 3</field>
<field name="price">12</field>
<field name="quantity">4</field>
</line>
<line name="item">
<field name="name">item 4</field>
<field name="price">5.5</field>
<field name="quantity">3</field>
</line>
</group>
To add a total line to this group, this script must be used:
addline("invoice", "LigneTotal",no
"total", "total = SUM('price'*'quantity')", yes
"moyenne", "moyenne = AVG('price'*'quantity')", yes
);
This script adds a total line at the end of the group:
<group name="invoice">
…
<line name="item">
<field name="name">item 4</field>
<field name="price">5.5</field>
<field name="quantity">3</field>
</line>
<line name="LigneTotal">
<field name="total">total = 99.5</field>
<field name="moyenne">moyenne = 24.875</field>
</line>
</group>
Using the Pre-calculation option set to "no" allows you to not execute calculations when adding the line to the group but when executed by the template. The advantage of this option is to perform calculations only with the written data on the current page, thus allowing the writing of subtotals.
To add a sub-total line to the previous group, use this script:
addline("invoice","LineSubtotal",yes, "subtotal","sub-total = SUM('price'*'quantity')",no);
This script adds a total line at the end of the group:
<group name="invoice">
…
<line name="item">
<field name="name">item 4</field>
<field name="price">5.5</field>
<field name="quantity">3</field>
</line>
<line name="LineSubtotal" pagebreak=”1”>
<field name="subtotal">sub-total = SUM('price'*'quantity')</field>
</line>
</group>
Pagination management
Managing information writing of pagination such as the total number of pages, the number of the batch and the number of pages in the batch is possible in Designer through the following two options:
Batch breaking
The Batch breaking option can be found in the Properties of the template (see 4.2. Creating a project). It defines a Metadata type zone which will be used to group the pages of the final document in batch.
![]()
During page processing:
- If the Metadata type zone retrieves a new value then a new batch is created. The current page will belong to this new batch.
- If the Metadata type zone retrieves a value which was already previously recovered, the current page is moved to the batch corresponding to that value.
- If no value is recovered by the Metadata type zone, the page remains in the same batch as the previous page.
The multi-document system of XPS is used to represent the batch, the output file is sorted by sequence (first pages of the first batch and the second pages, etc ...).
Replacement variables
There are "post-treatment" type variables to enable information writing of pagination, that is to say they will be replaced by their real value at the printing time.
These variables can be used into zones or in text blocks:
MAP_TOTAL_PAGE = total number of pages.
MAP_TOTAL_DOC = total number of batches.
MAP_TOTAL_PAGE_IN_DOC = number of pages in the current batch.
The syntax used is the following:
PST:'''''name of the variable''''';'''''default value'''''
The "default value" is mandatory and allows you to have a text in the page. This temporary text will then be replaced by its real value. It is important because it is through this text that the positioning calculations will be done. This text must therefore have a number of character at least equal to the maximum value expected by the used variable.
For example:
Displays "000" in the page, but at the printing time this value will be replaced by:
- " 5" if there are 5 pages in total.
- " 10" if there are 10 pages in total.
- "150" if there are 150 pages in total.
Other syntaxes also exist, and are accessible during page processing:
VAR:MAP_CURRENT_PAGE = number of the current page.
VAR:MAP_CURRENT_DOC = number of the current batch (the Metadata zone managing the batch breaking must be defined before using this variable).
VAR:MAP_CURRENT_PAGE_IN_DOC = number of the current page in the current batch.
And in general:
VAR:variable d’env = retrieve the contents of the environment variable.
Managing widows-and-orphans
Complex management of widows and orphans is possible through two features: Entire group and Repeat an XML group.
Entire group
When using a Limit type of page break generation, a new option appears in the group Properties: Entire group. This option specifies that the group cannot be cut and it must be printed in full on a single page. If the limit triggers a page break, no line from the group will be printed, the group will be fully processed on the next page.

XML group repetition
The XML group repetition assumes that the group appears several times in the input XML file. This feature is enabled with the parameter "Repeat" in the group properties.
![]()
Example:
In the example below, the group “invoice” appears three times in the XML. By default, the group of the template retrieves the information from the first appearance of the group in the XML. But if the "Repeat" option is checked, the execution of the group will continue on all occurrences.
<group name="invoice">
<line name="item">
<field name="name">item 1</field>
<field name="price">10</field>
<field name="quantity">2</field>
</line>
<line name="description">
<field name="description">Description item 1</field>
</line>
</group>
<group name="invoice">
<line name="item">
<field name="name">item 2</field>
<field name="price">5</field>
<field name="quantity">3</field>
</line>
<line name="description">
<field name="description">Description item 2</field>
</line>
</group>
<group name="invoice">
<line name="item">
<field name="name">item 3</field>
<field name="price">12</field>
<field name="quantity">4</field>
</line>
<line name="description">
<field name="description">Description item 3</field>
</line>
</group>
The cumulative use of a boundary generating page breaks with the “Entire group” option and the active repetition allows you to manage a complex system of widows and orphans.
In our example, the "item" lines and the "description" lines cannot be separated by a page break.