ONYX - 9.0 - Utilisation
Dynamic tables
Sommaire
Introduction
This documentation describes the methodology for creating a table with contours based on its content. This will allow you to generate, for example, a document with several boxes following one another.
This documentation describes the methodology with a paginated text file as input, but the principle remains the same with an XML Designer file.
Step-by-step guide to creating a dynamic table
A dynamic table is a table that adapts its size according to its content. This increases or decreases depending on the spool and XML input file.
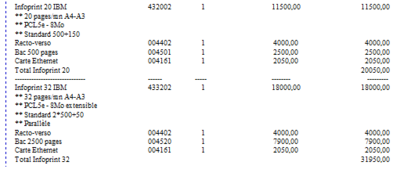
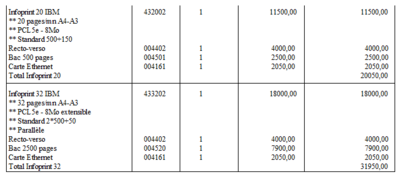
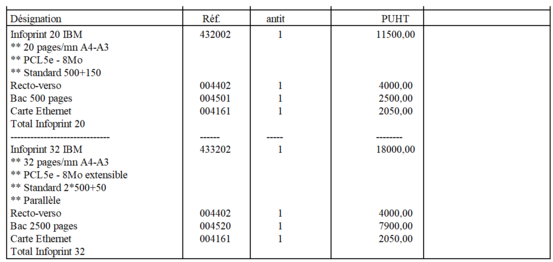
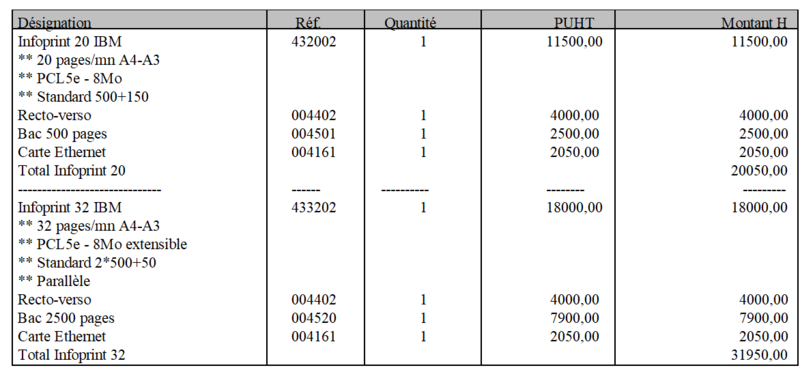
In the example below, we want to create a table displaying the data from the table present in the input spool. This looks like the table below:
    -----------------------------------------------------------------------------------
    ! Designation                     !  ID    !  Quantity  !   PUHT   !  Amount  HT  !
    -----------------------------------------------------------------------------------
    ! Infoprint 20 IBM                ! 432002 !        1   ! 11500,00 !   11500,00   !
    ! ** 20 pages/mn A4-A3            !        !            !                         !
    ! ** PCL5e - 8Mo                  !        !            !          !              !
    ! ** Standard 500+150             !        !            !          !              !
    ! Duplex                          ! 004402 !        1   !  4000,00 !    4000,00   !
    ! Drawer 500 pages                ! 004501 !        1   !  2500,00 !    2500,00   !
    ! Ethernet card                   ! 004161 !        1   !  2050,00 !    2050,00   !
    ! Total Infoprint 20              !        !            !          !   20050,00   !
    !---------------------------------------------------------------------------------!
    ! Infoprint 32 IBM                ! 433202 !        1   ! 18000,00 !   18000,00   !
    ! ** 32 pages/mn A4-A3            !        !            !          !              !
    ! ** PCL5e - 8Mo extensible       !        !            !          !              !
    ! ** Standard 2*500+50            !        !            !          !              !
    ! ** Parallel                     !        !            !          !              !
    ! Duplex                          ! 004402 !        1   !  4000,00 !    4000,00   !
    ! Bac 2500 pages                  ! 004520 !        1   !  7900,00 !    7900,00   !
    ! Ethernet card                   ! 004161 !        1   !  2050,00 !    2050,00   !
    ! Total Infoprint 32              !        !            !          !   31950,00   !
    -----------------------------------------------------------------------------------
Generalities
- Always use default FRONT spacing
- Put spacing AFTER only if you want additional space below the line
- The size of vertical lines and rectangles must be: spacing BEFORE + spacing AFTER
- Small vertical lines must have a Y offset of “- FRONT spacing”
- Rectangles must have a Y offset of “+ spacing AFTER”
- Rectangles must not have an outline (their outlines must be managed manually with lines and vertical strokes)
- Objects in a line must remain in their workspace (vertical space of a line: Spacing before and Spacing after)
Creation of a variable group
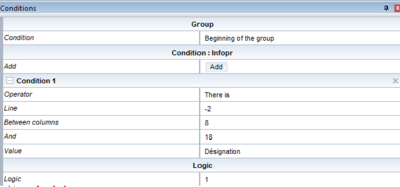
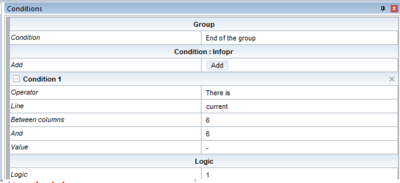
The first thing to do is to create a variable group delimiting the start row and the end row of the table. (Start line: Line containing the word “Designation” and the end line containing the character “-” in column 6)
To do this, we will create a variable group:
Start Condition
In the group properties, select "type of stop condition" to "Condition". This will cause the drop-down list to appear in the group conditions: “Beginning of the group” and “End of the group”
End Condition
Displaying table contents
At this point, the group has a start and an end, but it displays nothing because no zone has been placed inside it.
All lines in the group
To display the contents of the table, you must put one zone per column.
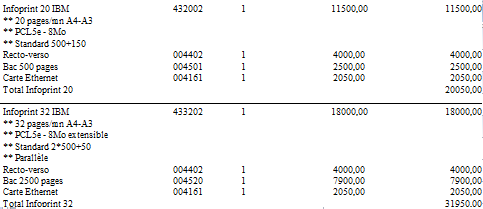
Here is the overview of the table:
Management of horizontal article separator lines
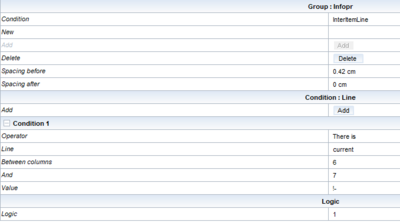
In the preview above, we can see the discontinuity of the horizontal lines. To solve this problem, we must add a horizontal line conditioned on the presence of the article separator line in the input file. This line should only appear if we are on the dotted line separating 2 items.
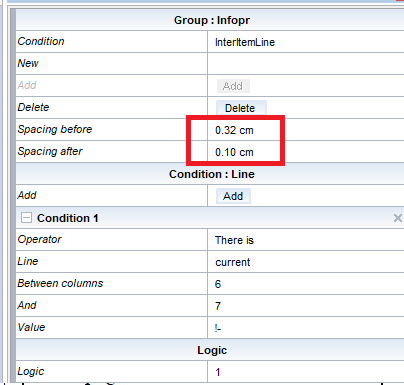
Here are the properties of the horizontal line we just created:
Here is the new rendering of the preview:
In order to vertically center the line, we can apply a vertical offset of approximately 0.1cm upwards.
Important: To respect the rule that each object must remain in the workspace of the line in which it belongs, it will therefore be necessary to add spacing after the article separator line. We will add 0.1 cm in spacing after and to keep the total height of 0.42cm, we will add 0.32cm in spacing before.
Vertical lines management
On lines None
In the preview above, we can see that the columns are missing. To add them, you must include a vertical line of height “spacing before” + “spacing after” executed on all the “None” condition lines having a Y offset of “– spacing before”
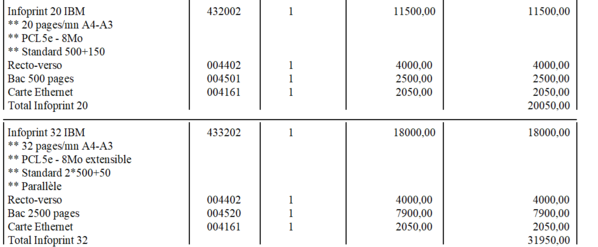
The rendering is like this:
We can see several issues in this new overview:
- The item separator line does not have a vertical line
- The table is not closed
These two issues will be addressed in the following chapters.
On article separator lines
In our example, the spacing before the item separator line is 0.32cm and the spacing after 0.1cm. Therefore, the vertical line for this line must be 0.42cm high and must have an upward offset of -0.32cm
All that remains is to duplicate the vertical line to make the other columns.
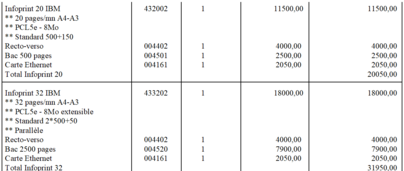
The result is now like this:
Closing the table
There are several ways to make the closing end line of the table.
Either :
- We enlarge the table a little to take the end line
- We make a group of one line which follows the group of the invoice
In our example, we will use the 1st method
- We enlarge the table so that the last row includes the end row of the table.
- Then we make an "EndOfTable" only true condition at the very end of the table
- We apply a horizontal line to it
- We change the spacing before the "EndOfTable" condition to 0.20cm
- We treat vertical lines in the same way as seen previously
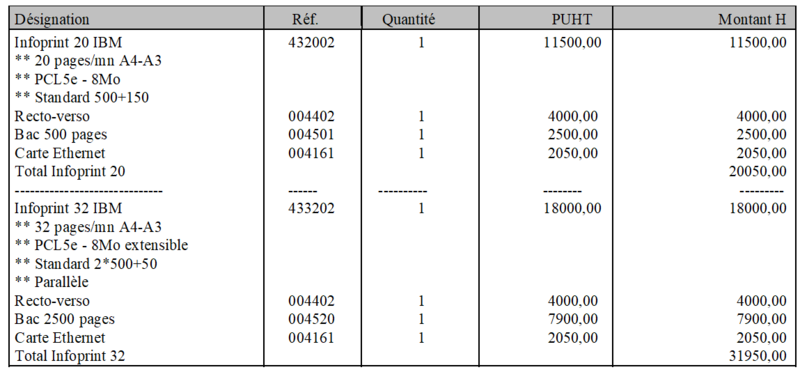
Result
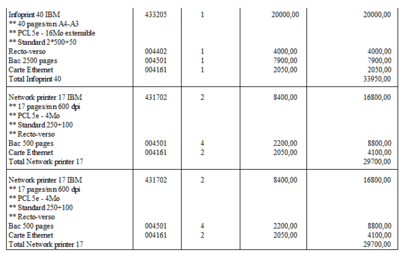
Page 1 :
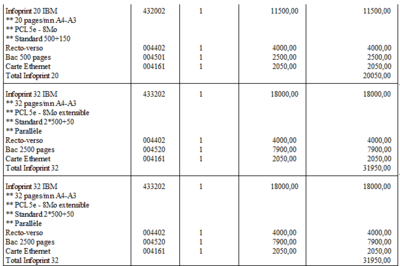
Page 2 :
Page 3 :
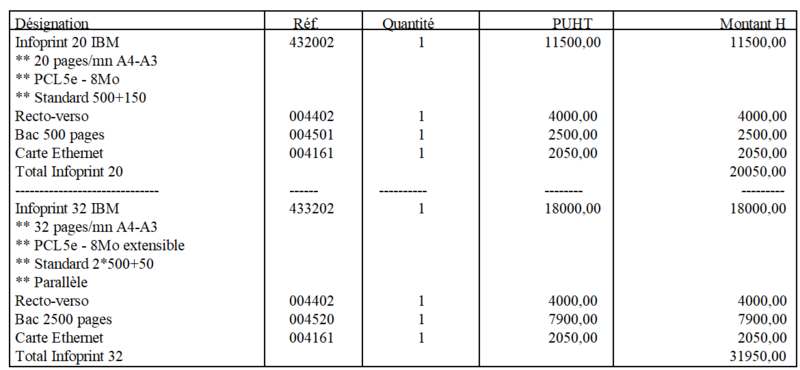
We can see that the table fits the content perfectly on all pages in the spool.
All that's left to do is manage the header part.
Management of the header line (Optional)
Previously, we saw the purely “outline of the table” part. However, we can see that the header part is not taken into account.
The header can be managed as needed:
- On the draw part (background)
- On the map part (dynamic part)
We will see the management of the header at the dynamic level (the most complex part in this scenario). To do this we will base ourselves on the spool header line
    -----------------------------------------------------------------------------------
    ! Designation                     !  ID    !  Quantity  !   PUHT   !  Amount  HT  !
    -----------------------------------------------------------------------------------
To do this, you must:
- Start the table at the start of the header, i.e. 3 lines before. (condition, if Line + 1, we have the word Designation)
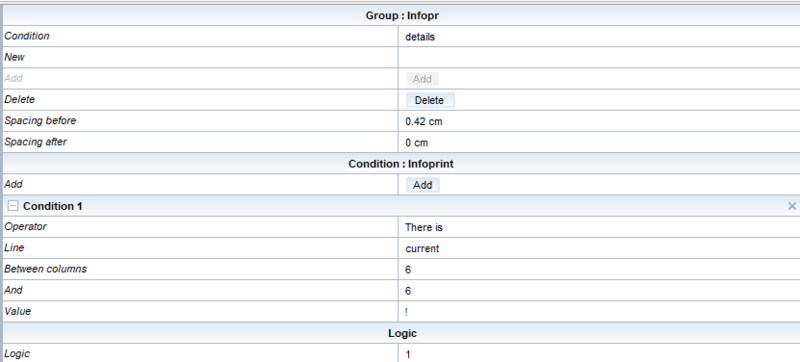
- Modify all objects in "None" condition by applying to them a "Details" condition of lines ignoring the 2 dotted lines of the header line and printing all the lines (if there is a ! in column 6)
The result is like this:
We must deal with the problem of vertical lines present at the very first row of the table.
These features are due to the fact that the 1st line is taken by the horizontal article separator line condition.
You simply have to create a condition taking the 2 dotted lines at the header, taking care not to put vertical lines on it.
We now no longer have the small vertical lines at the very beginning of the table.
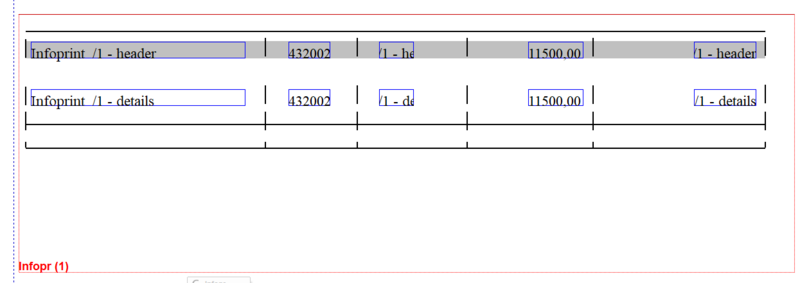
We want to highlight the table header by highlighting it in gray and making its contents bold. To do this, we will draw a rectangle with the following characteristics:
- Height: Spacing before + Spacing after
- Conditioned: On the header line (Condition: HEADER). Presence of the word Designation
- Outline of the table: 0 points (without outline)
- In the list of objects, put the Header condition above the "Details" condition
Here is the new preview:
It now remains to display the text on top as well as the column lines.
To do this, you must:
*Duplicate the areas displaying the spool content as well as the traits by assigning them to the "header" condition
*Ensure that the vertical lines respect the height and vertical offset rules seen previously in the doc
Now all you have to do is give a little space just below the header labels. To do this you must:
- Add spacing after: 0.1cm
- Modify the height of the rectangle and the properties of the vertical header lines to respect the rules seen previously
- Apply a vertical offset of “spacing after” to the rectangle, i.e. 0.1cm
We can see that the item separator line has disappeared. Indeed, this line is not taken by the "InterItemLine" condition but by the "details" condition. This is because the group is in an exclusive condition and the "details" line condition is checked before the "InterItemLine" condition. You must therefore position the "InterItemLine" condition above the "Details" condition in the list of objects.
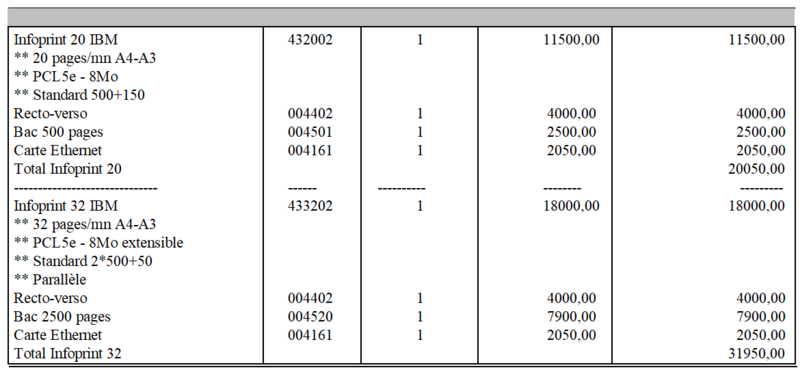
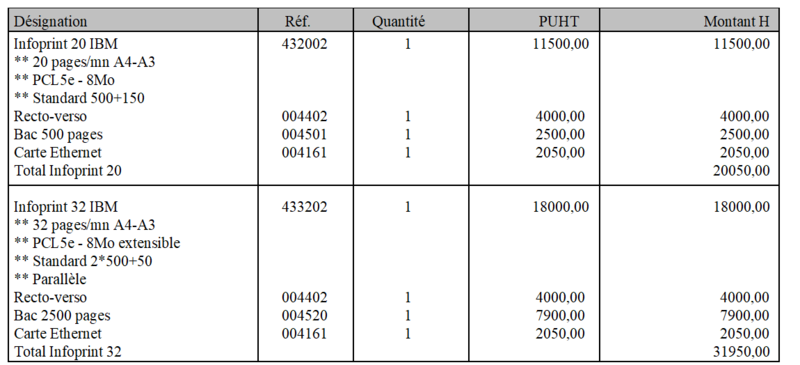
The final result will then be:
